
Showcase
Livox Online Classroom | Map Color Optimization Based on High-Precision Measurement of Reflectivity
2022-5-17Optimizing the colors of a lidar point cloud map
Recently, Dr. Wang Yusheng from the VaST research team at Wuhan University shared their work on using Livox lidars to generate maps in rail transit scenarios and optimizing the colors of point cloud maps based on high-precision measurement of reflectivity, to assist in the construction of rail transit semantic maps.
Measured Scenarios and Point Cloud Maps
The project team planned to build a map of large railway environments through self-developed SLAM algorithms combined with the automatic extraction of power transmission towers, railway tracks, and railway signals, to generate semantic maps of railway environments. In actual scenarios, certain features may be missed or incorrectly extracted in the automatic extraction process (such as the wrong identification of a railway signal as a power transmission pole). As a result, users would need to manually inspect the reconstructed point cloud map, which is cumbersome and time-consuming. Moreover, considering railway tracks are usually long and generate high volumes of point cloud data, good point cloud visualization is essential for efficient and accurate manual inspection.
The project team chose a freight maintenance area as the site for semantic map construction and manual inspection to test their method on point cloud map modification. The scene was reconstructed with multiple Livox lidars using self-developed Rail-SLAM algorithms, which also generated a semantic map automatically.
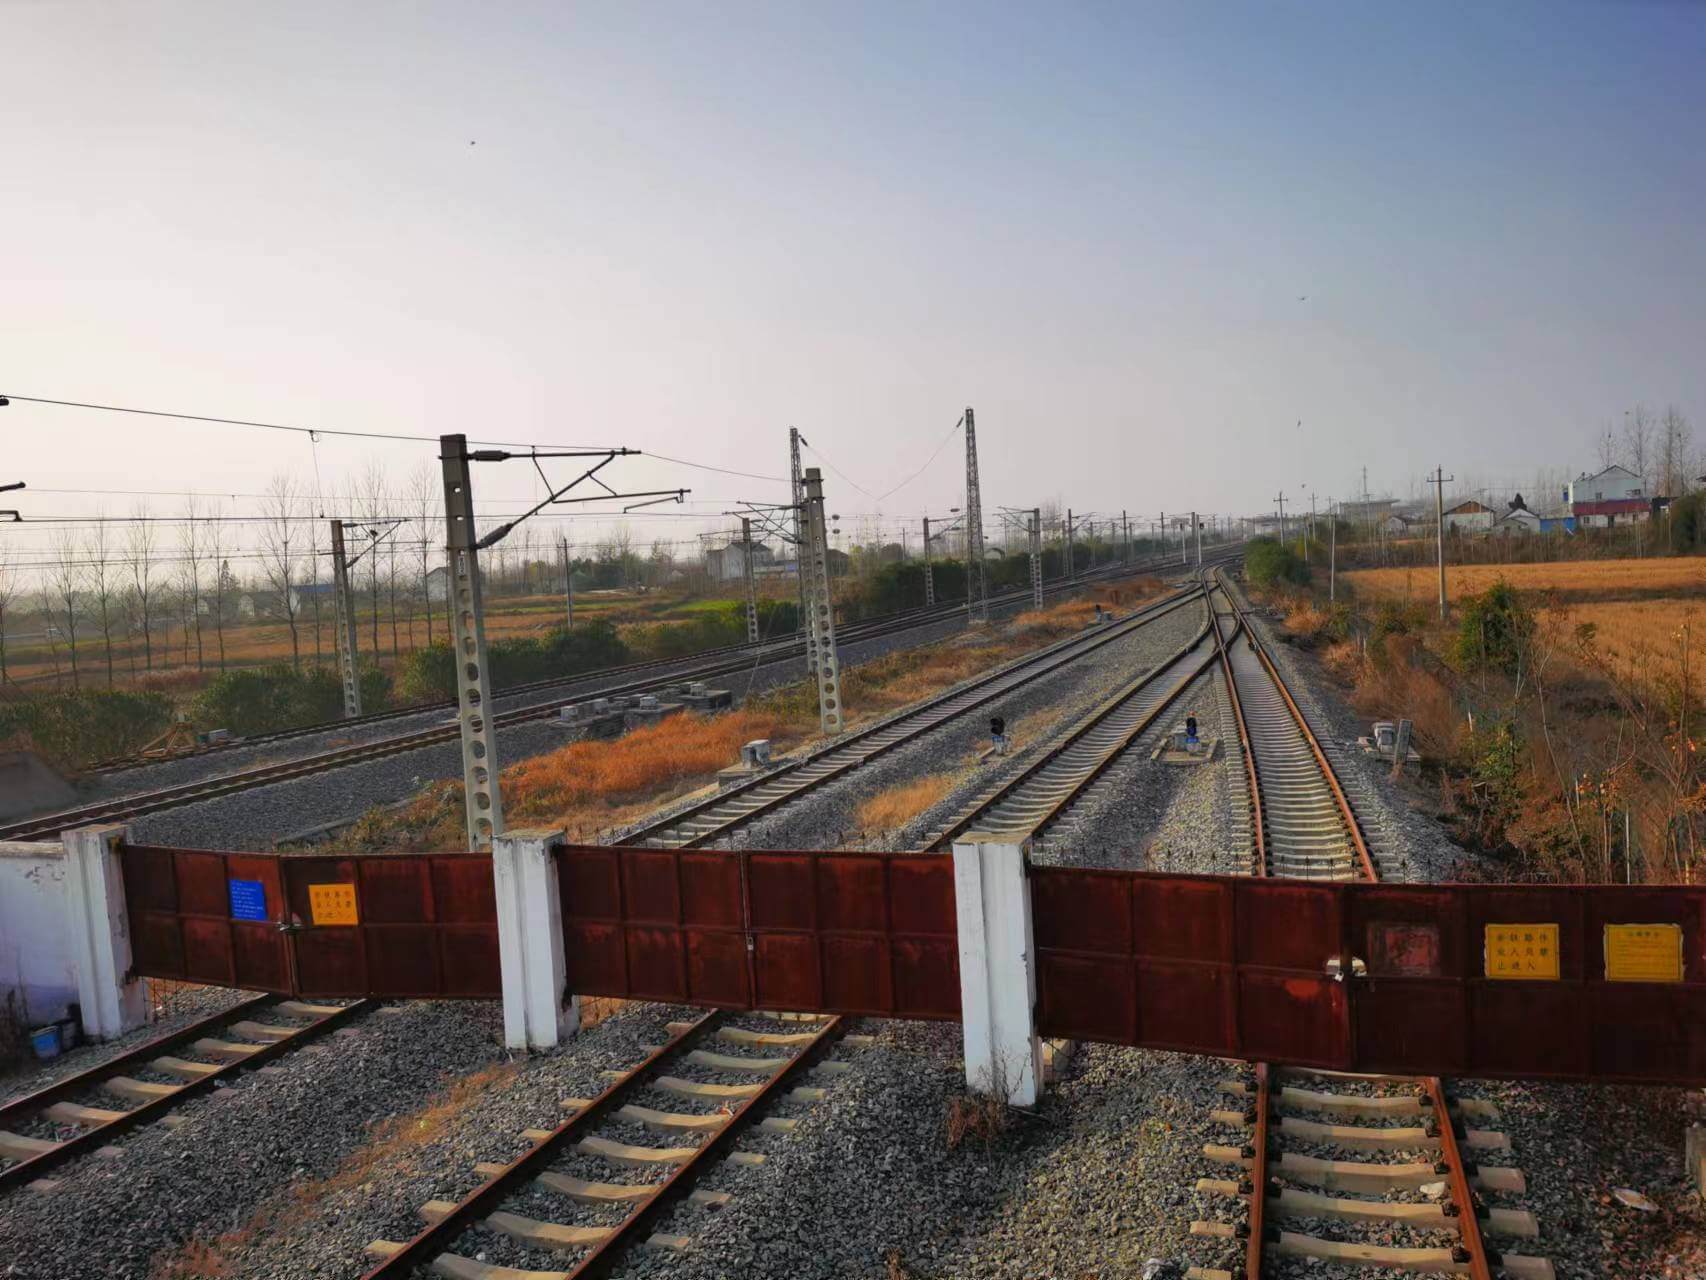
Image 1 The measured freight railway maintenance station
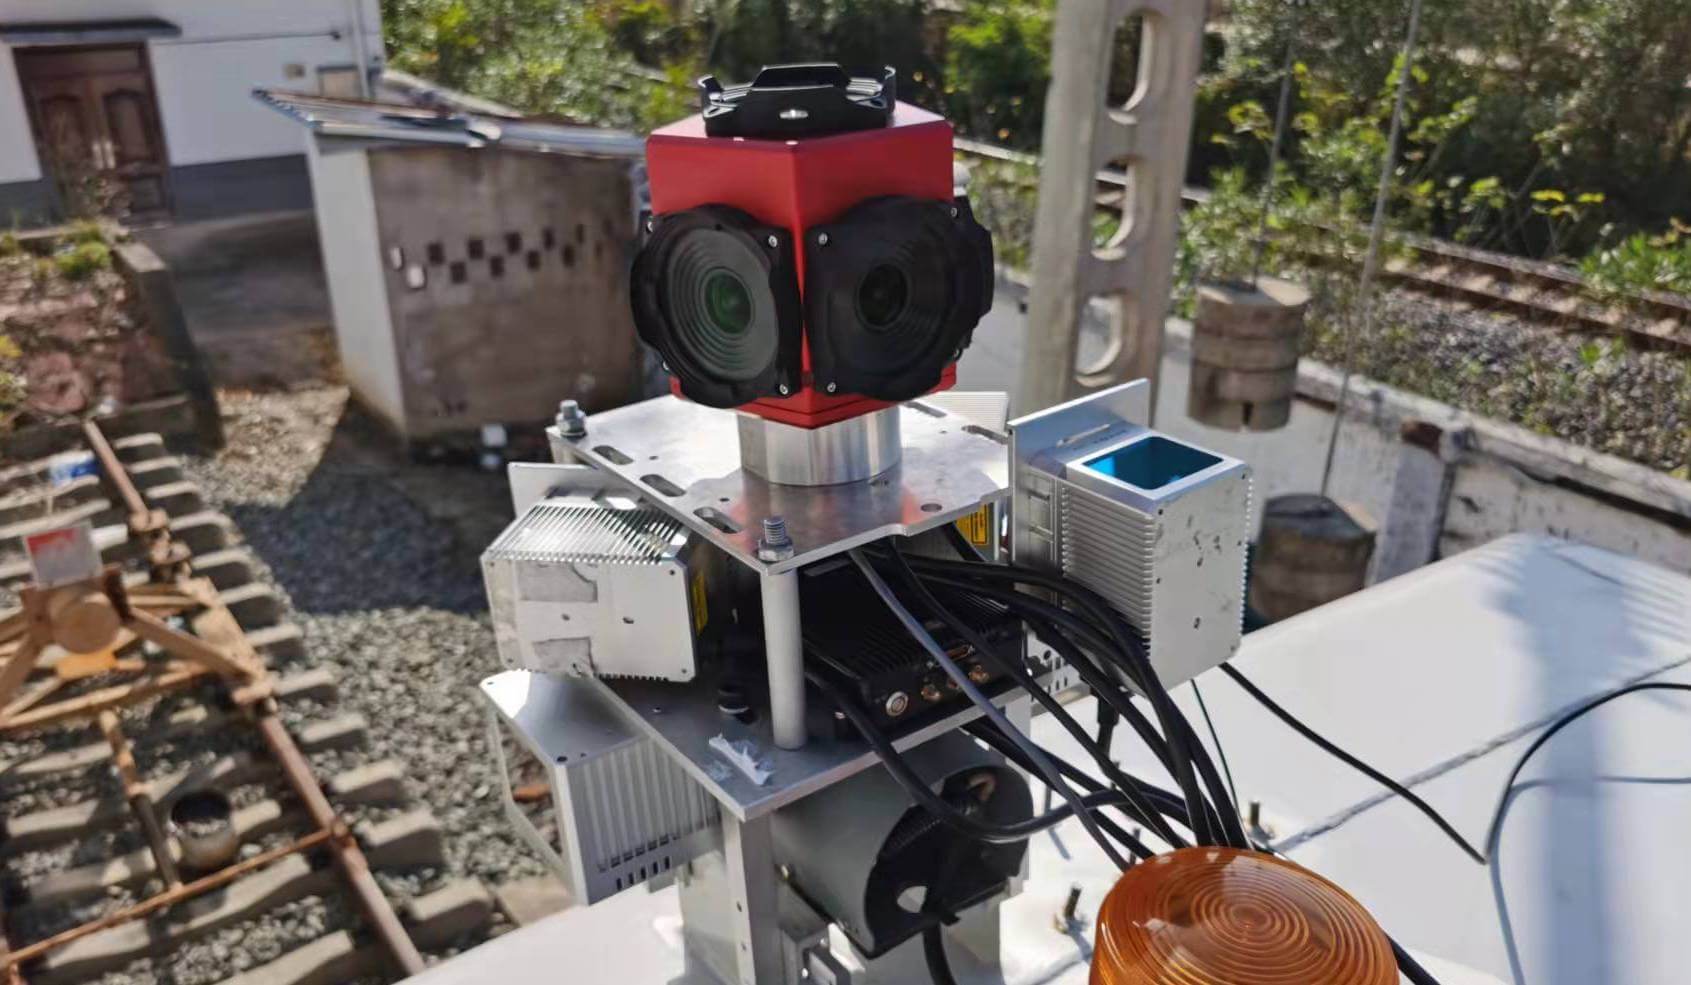
Image 2 The seven-LiDAR setup on the maintenance rail vehicle developed by the project team (5 Livox Horizon and 2 Livox Tele-15)
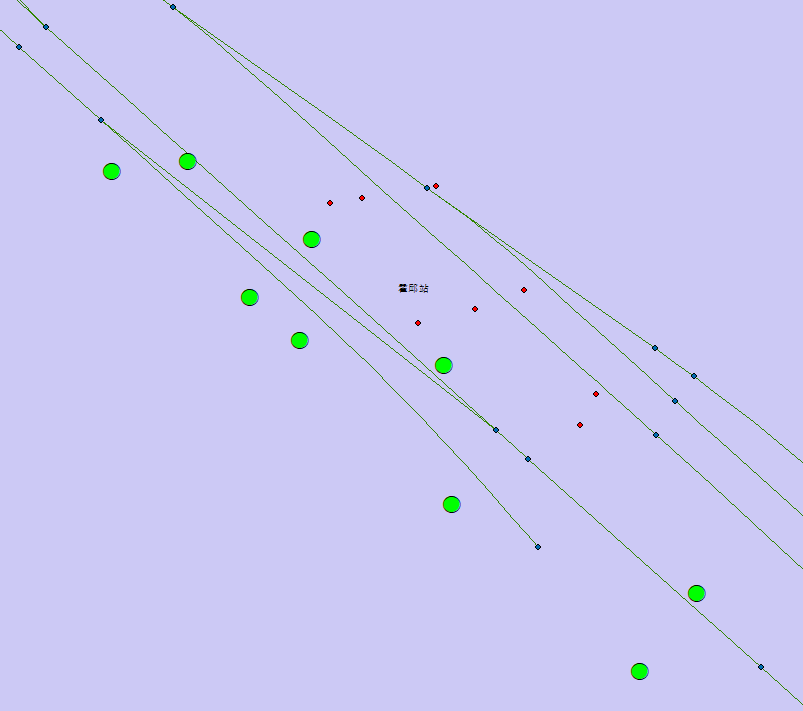
Image 3 A semantic map generated by self-developed algorithms - the green lines are the center lines of the railway tracks, the large green points are the power transmission towers, and the small points are the trackside signals.
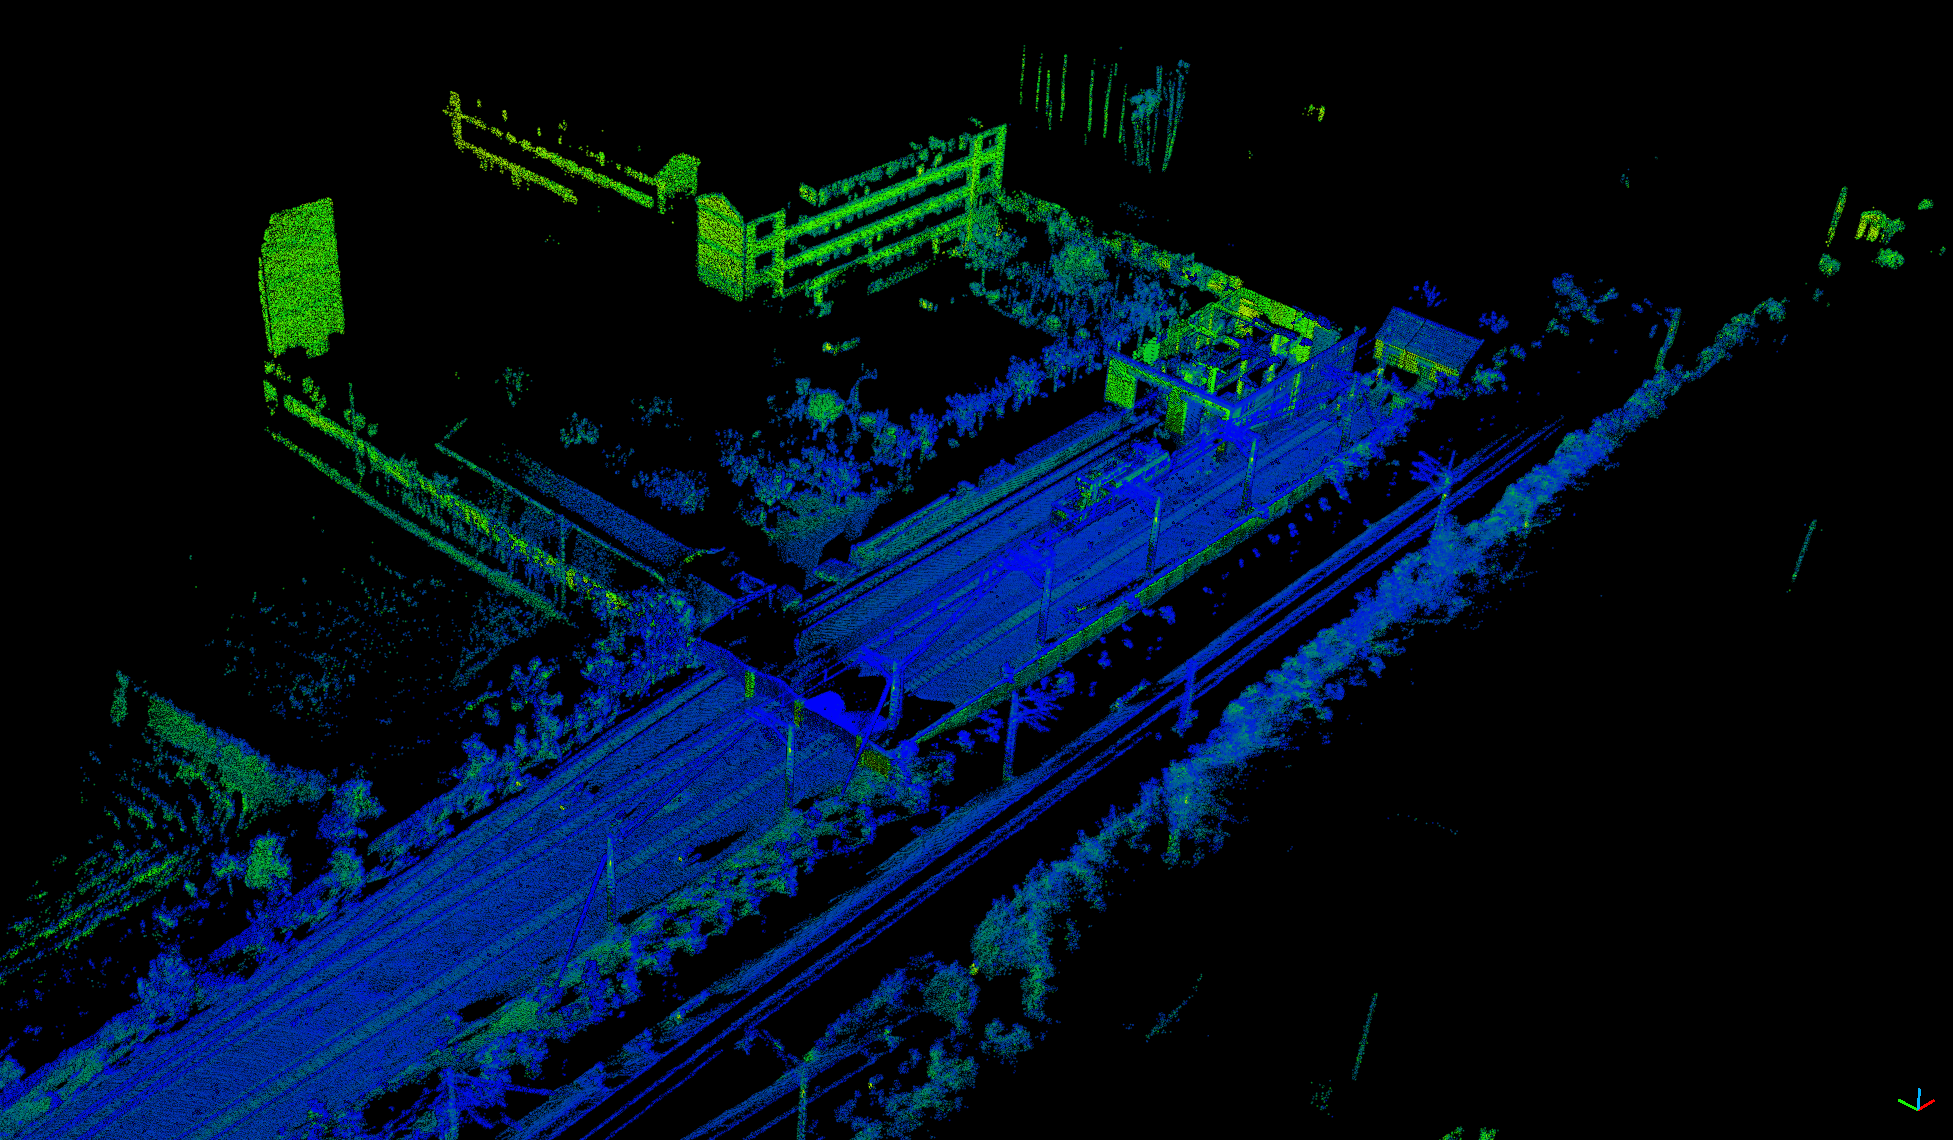
Image 4.1 Output from Livox Viewer in default resolution
The result showed that the tracks, sleepers, and other objects are clearly distinguishable due to data output based on their default reflectivity, thanks to the high-precision resolution of Livox lidars.
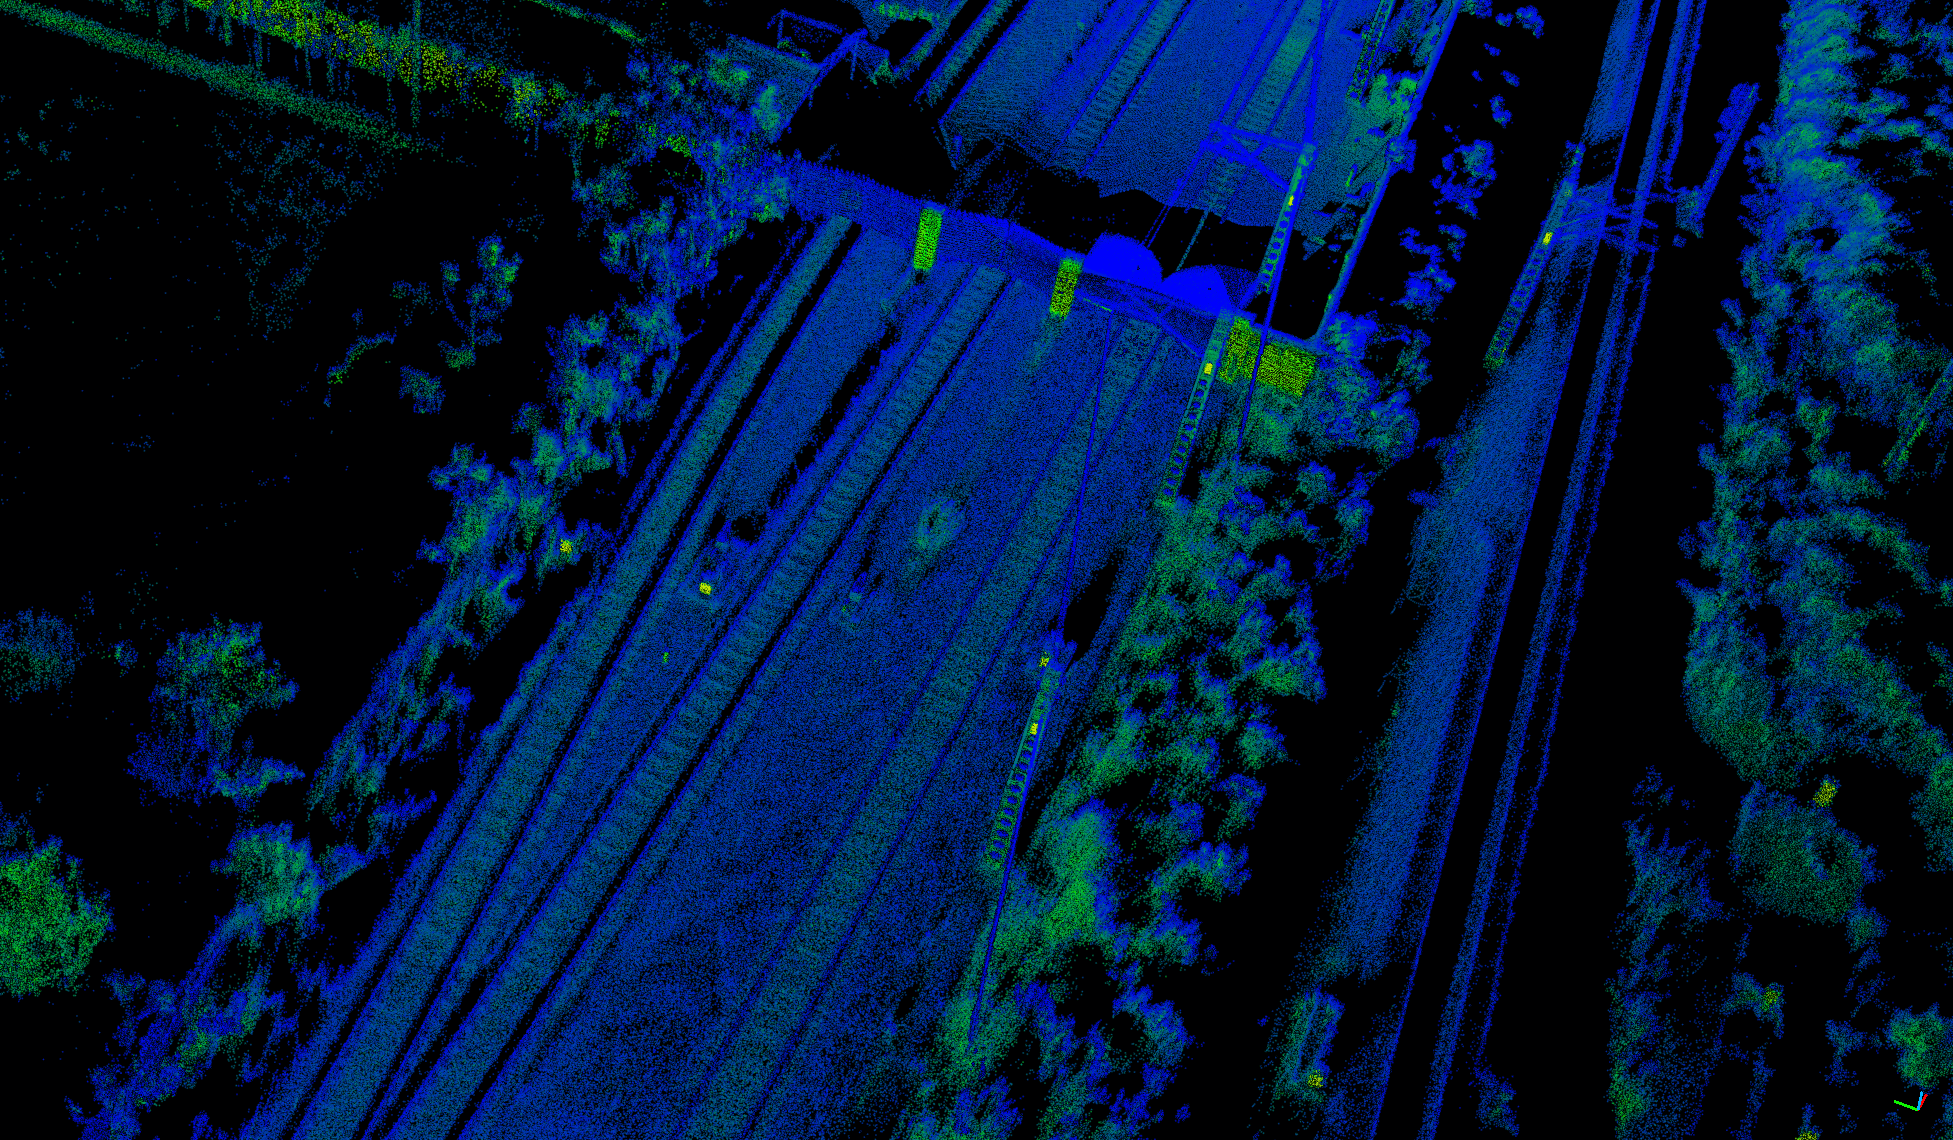
Image 4.2 Detailed image (Bottom left of Image 4.1)
As seen in Image 4.2, cement materials such as buildings and transmission towers appear in green; steel objects such as railway tracks and power lines appear in blue.
Video 1 Rail-SLAM mapping of a railway track
To avoid false positives in the detection of similar material objects due to non-obvious color changes and similar reflectivity, the project team further optimized the point cloud maps using an editing software.
Optimization method
Required software: CloudCompare (on Windows or Ubuntu)
First, import the constructed map into CloudCompare; then select “Display by Reflection Intensity” and display the map in “High Contrast”. You may choose to use the shader depending on the display quality; or adjust the point size according to point cloud density. Lastly, save the optimized point cloud map.
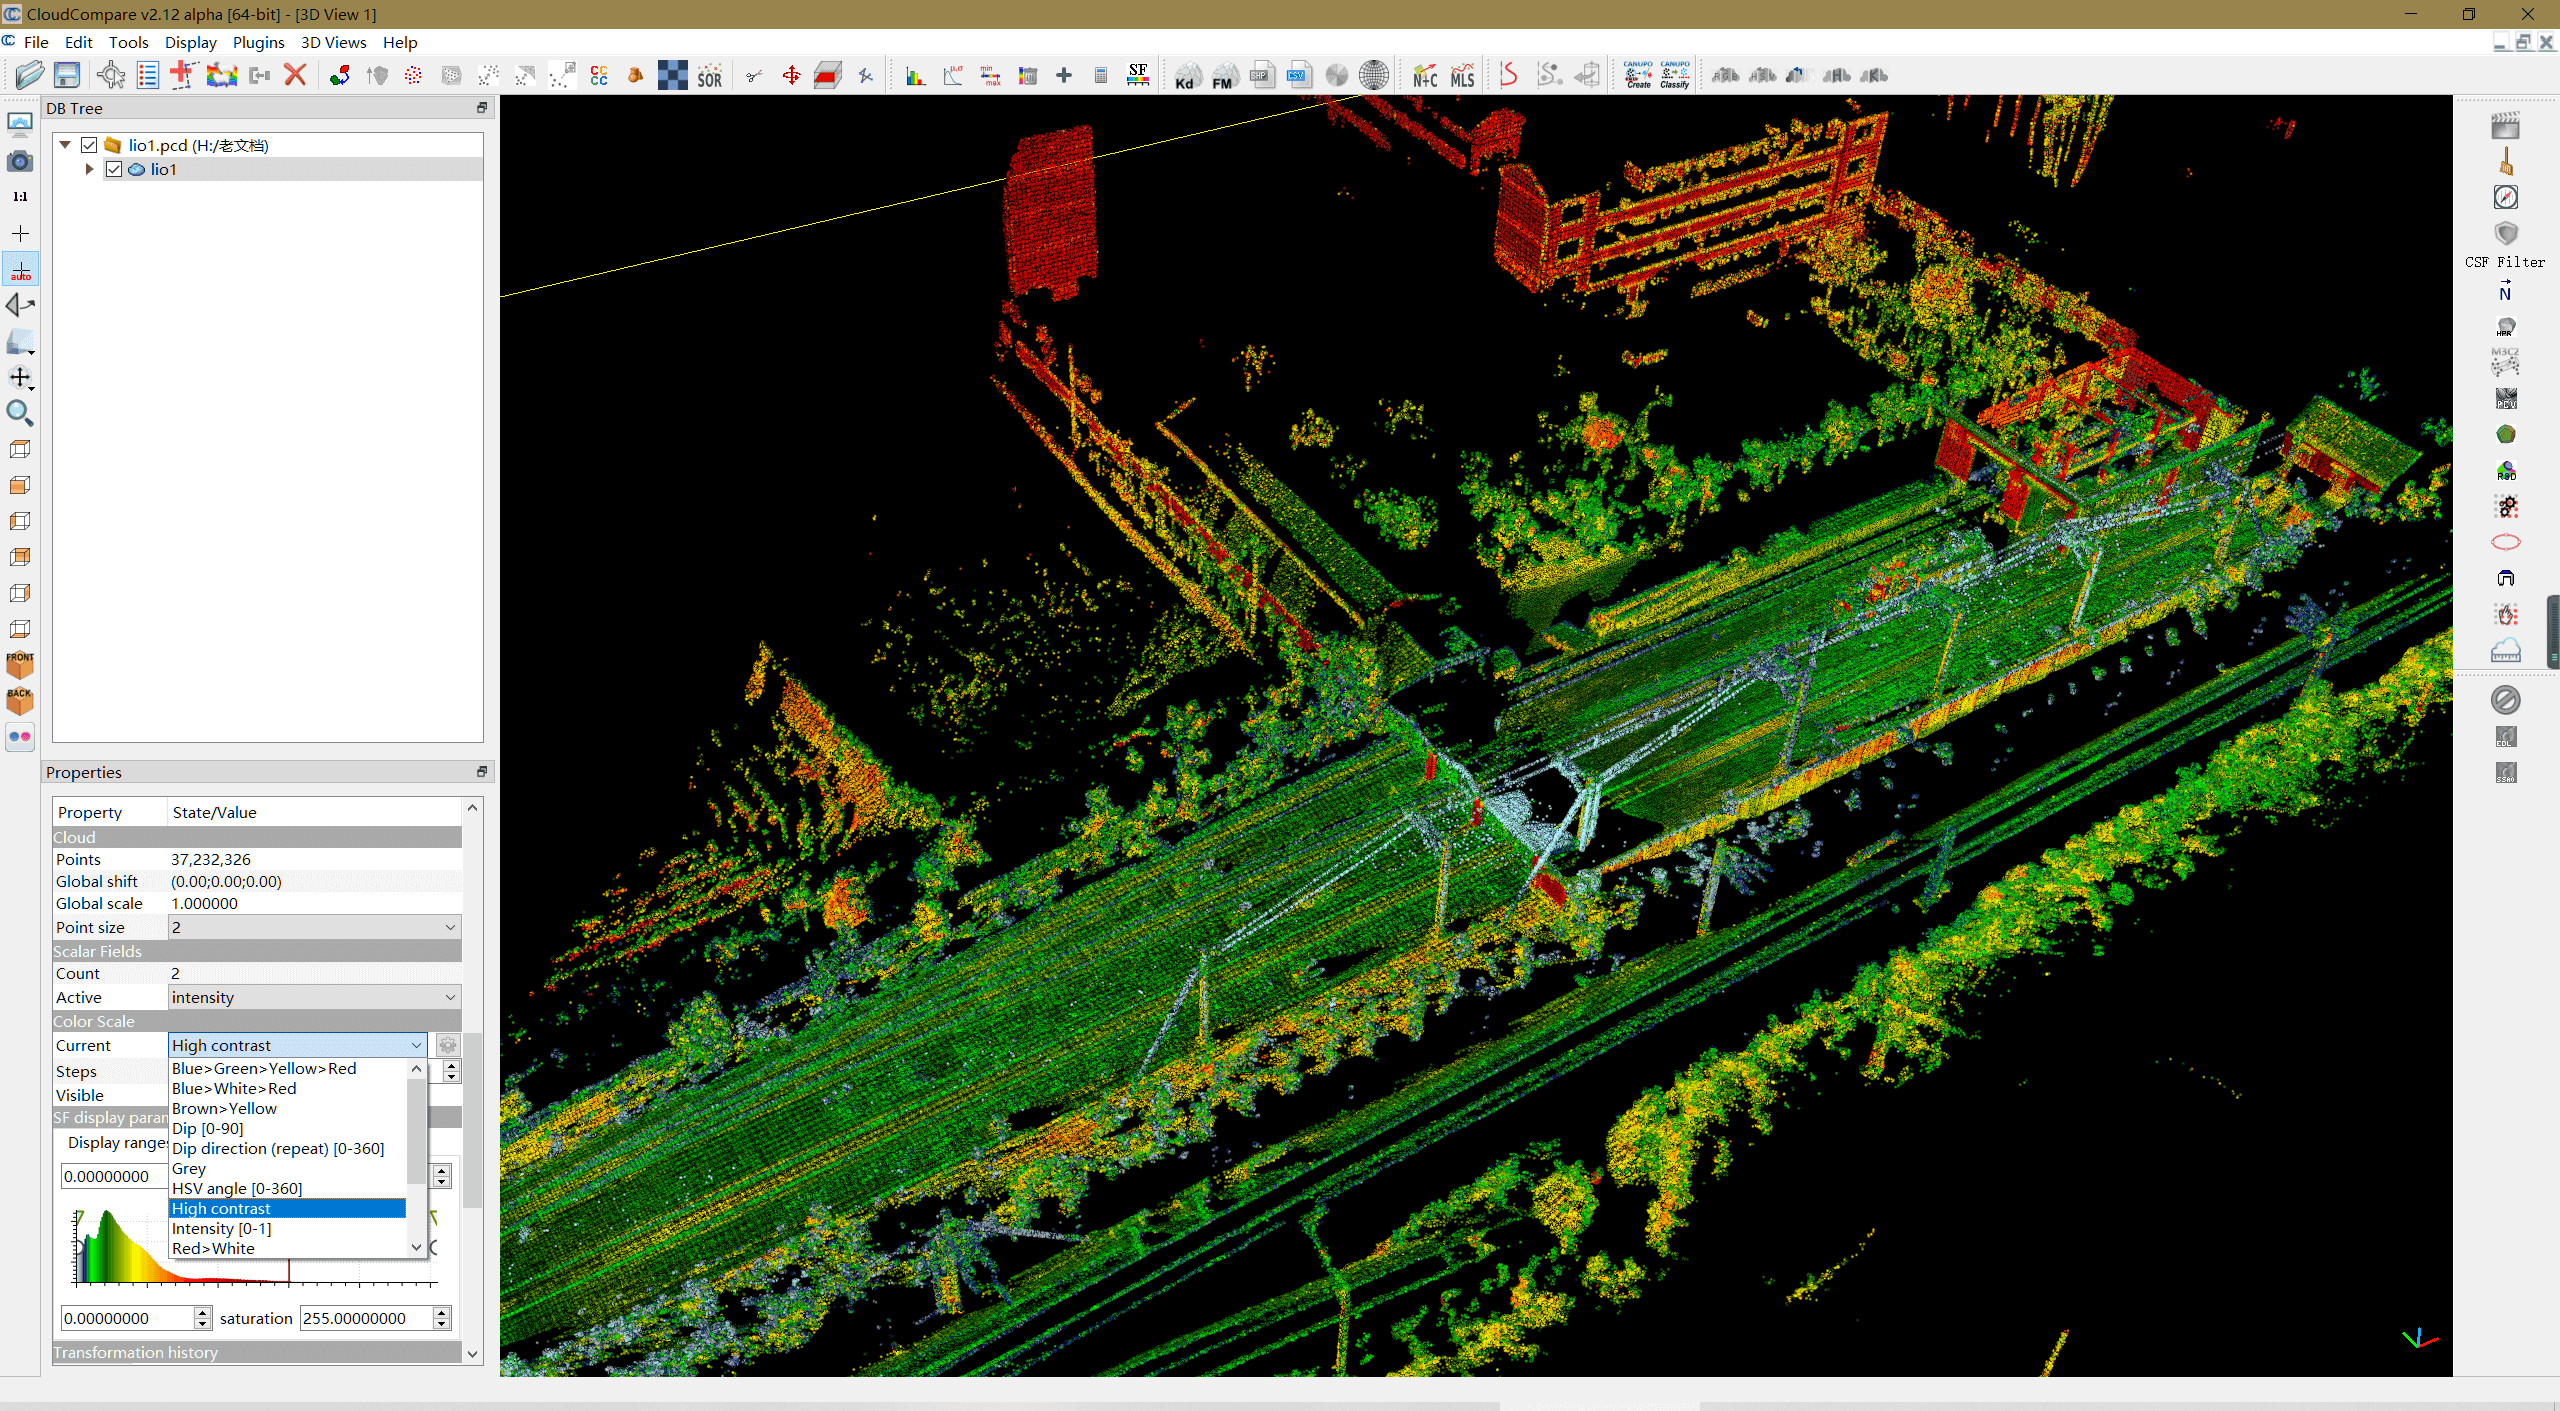
Image 5 The configuration interface
Because of the high-precision algorithms developed for the project and the high-density point clouds of Livox, the images below show that even if a train travels at a high speed up to 70 km/h, tiny objects such as the holes on the towers, railway signals, and junctions can be easily seen.
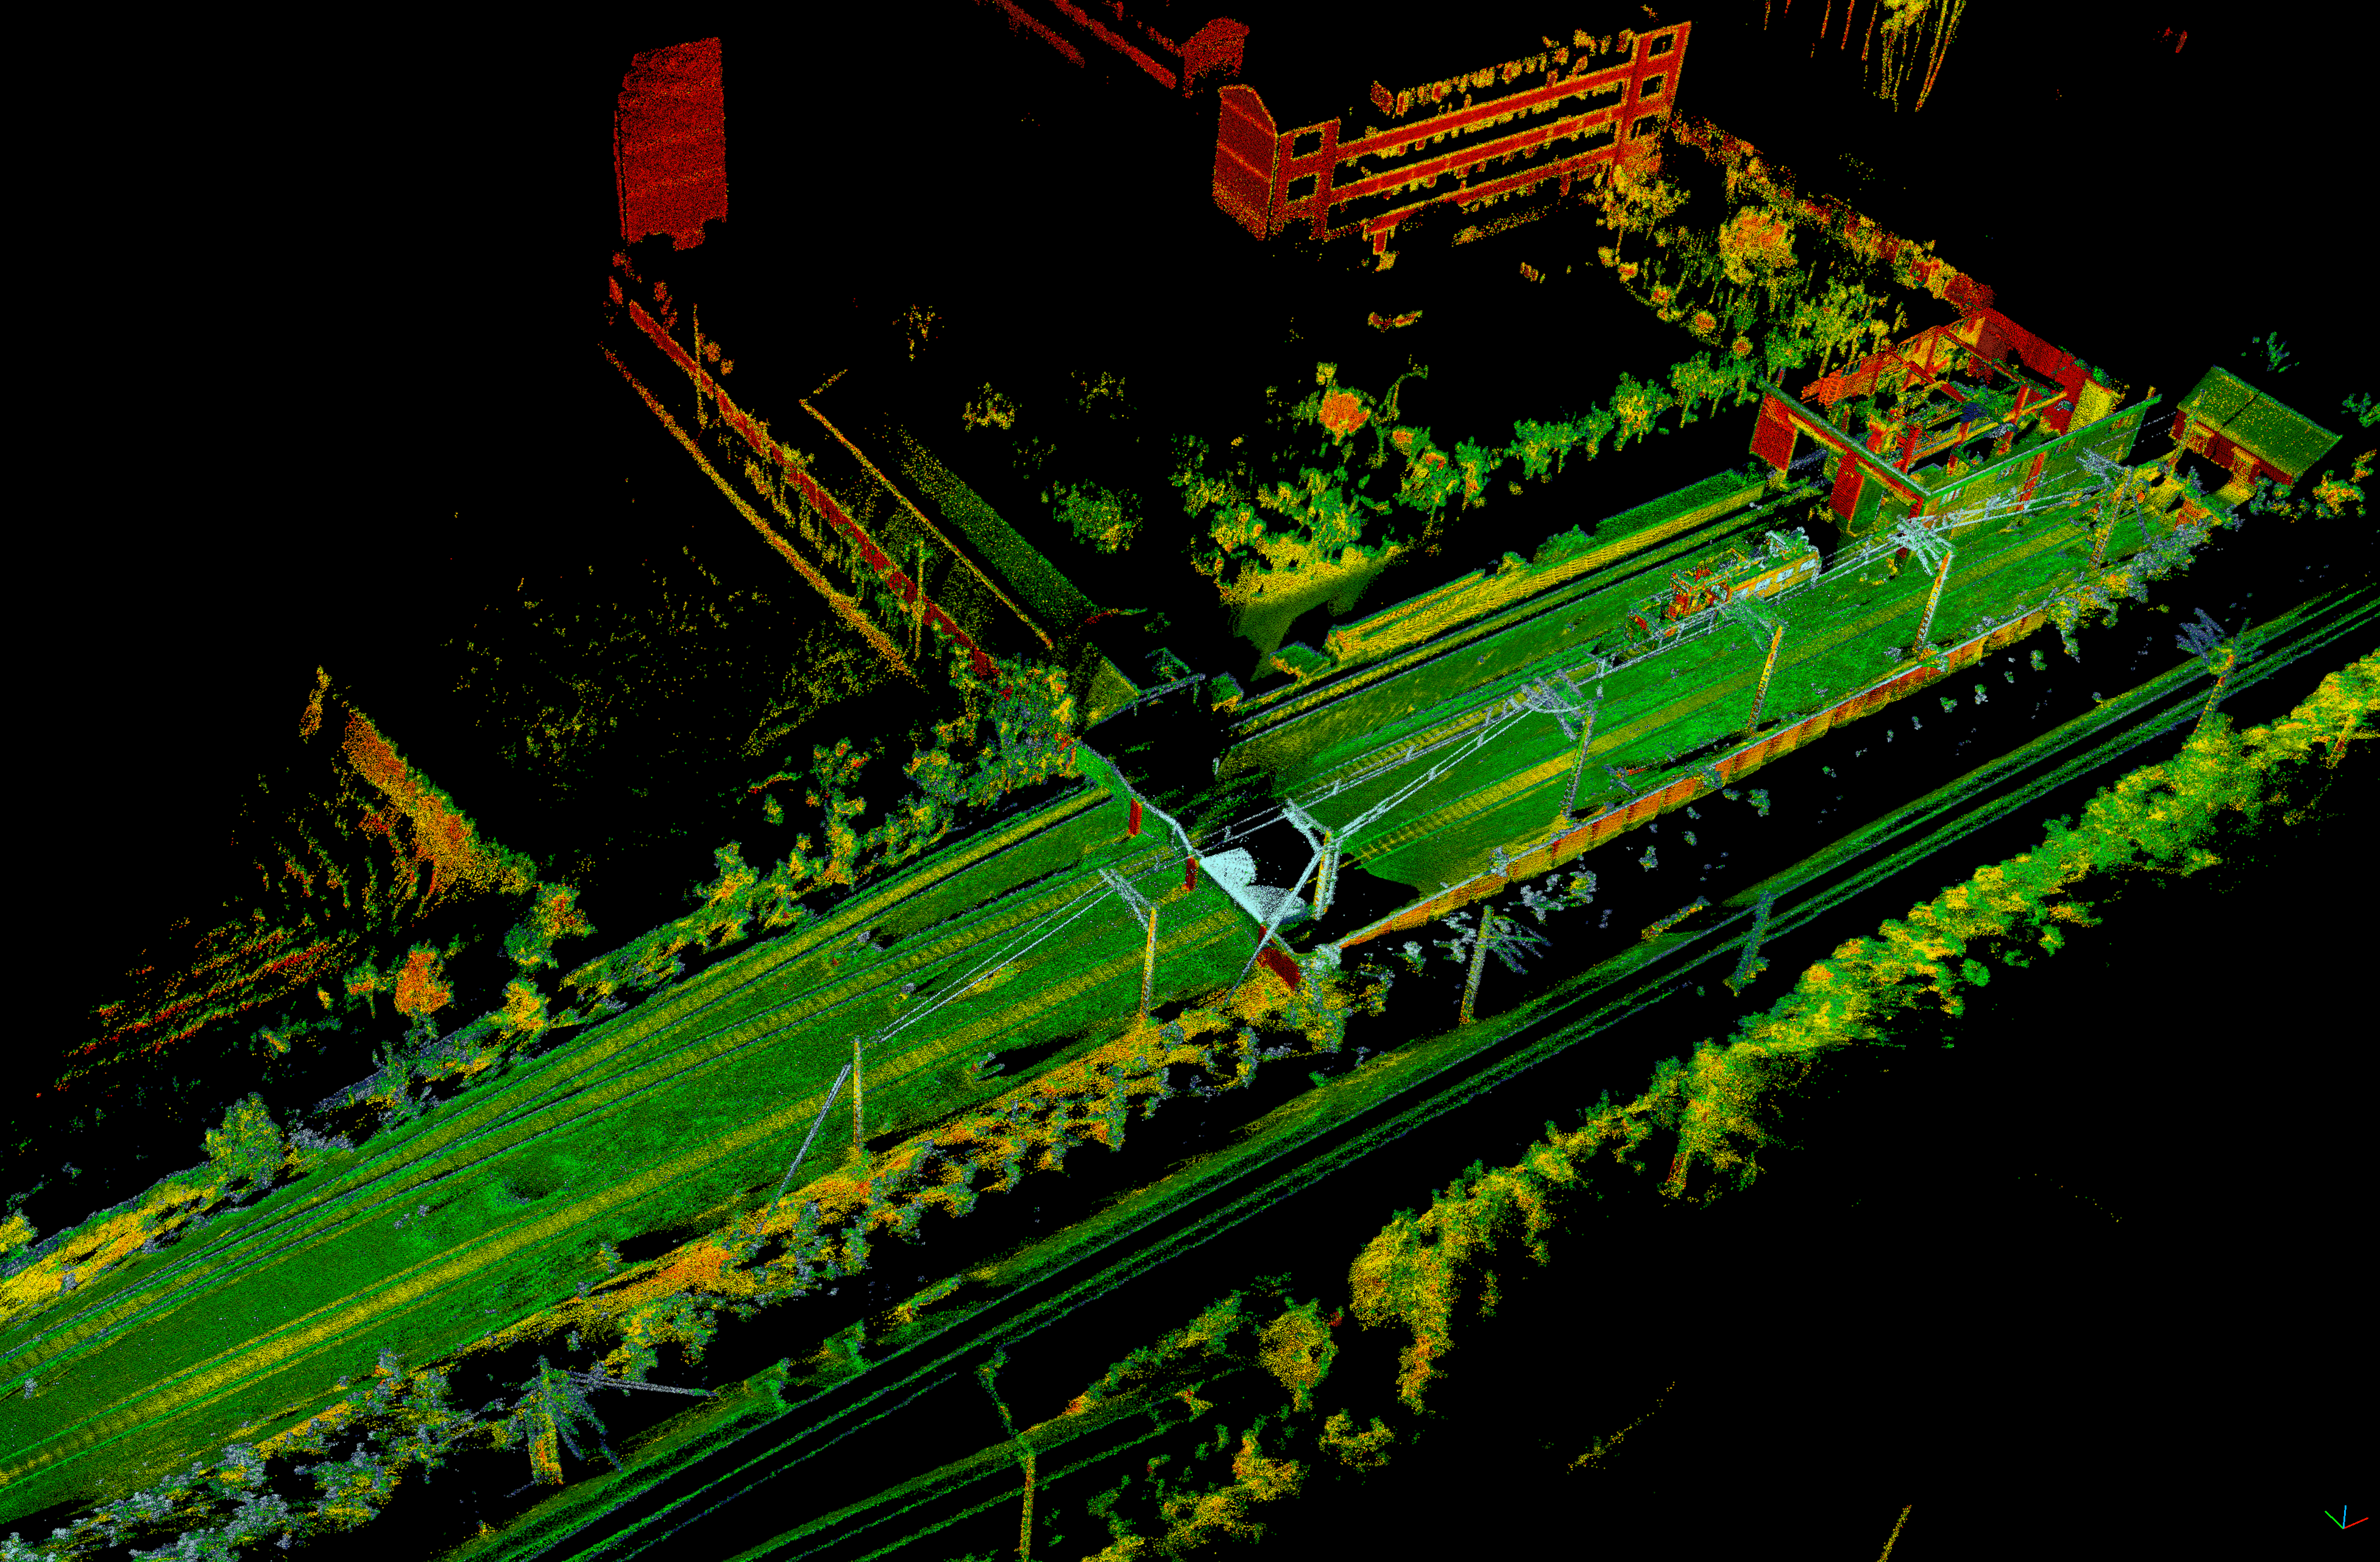
Image 6.1 Optimized point-cloud map
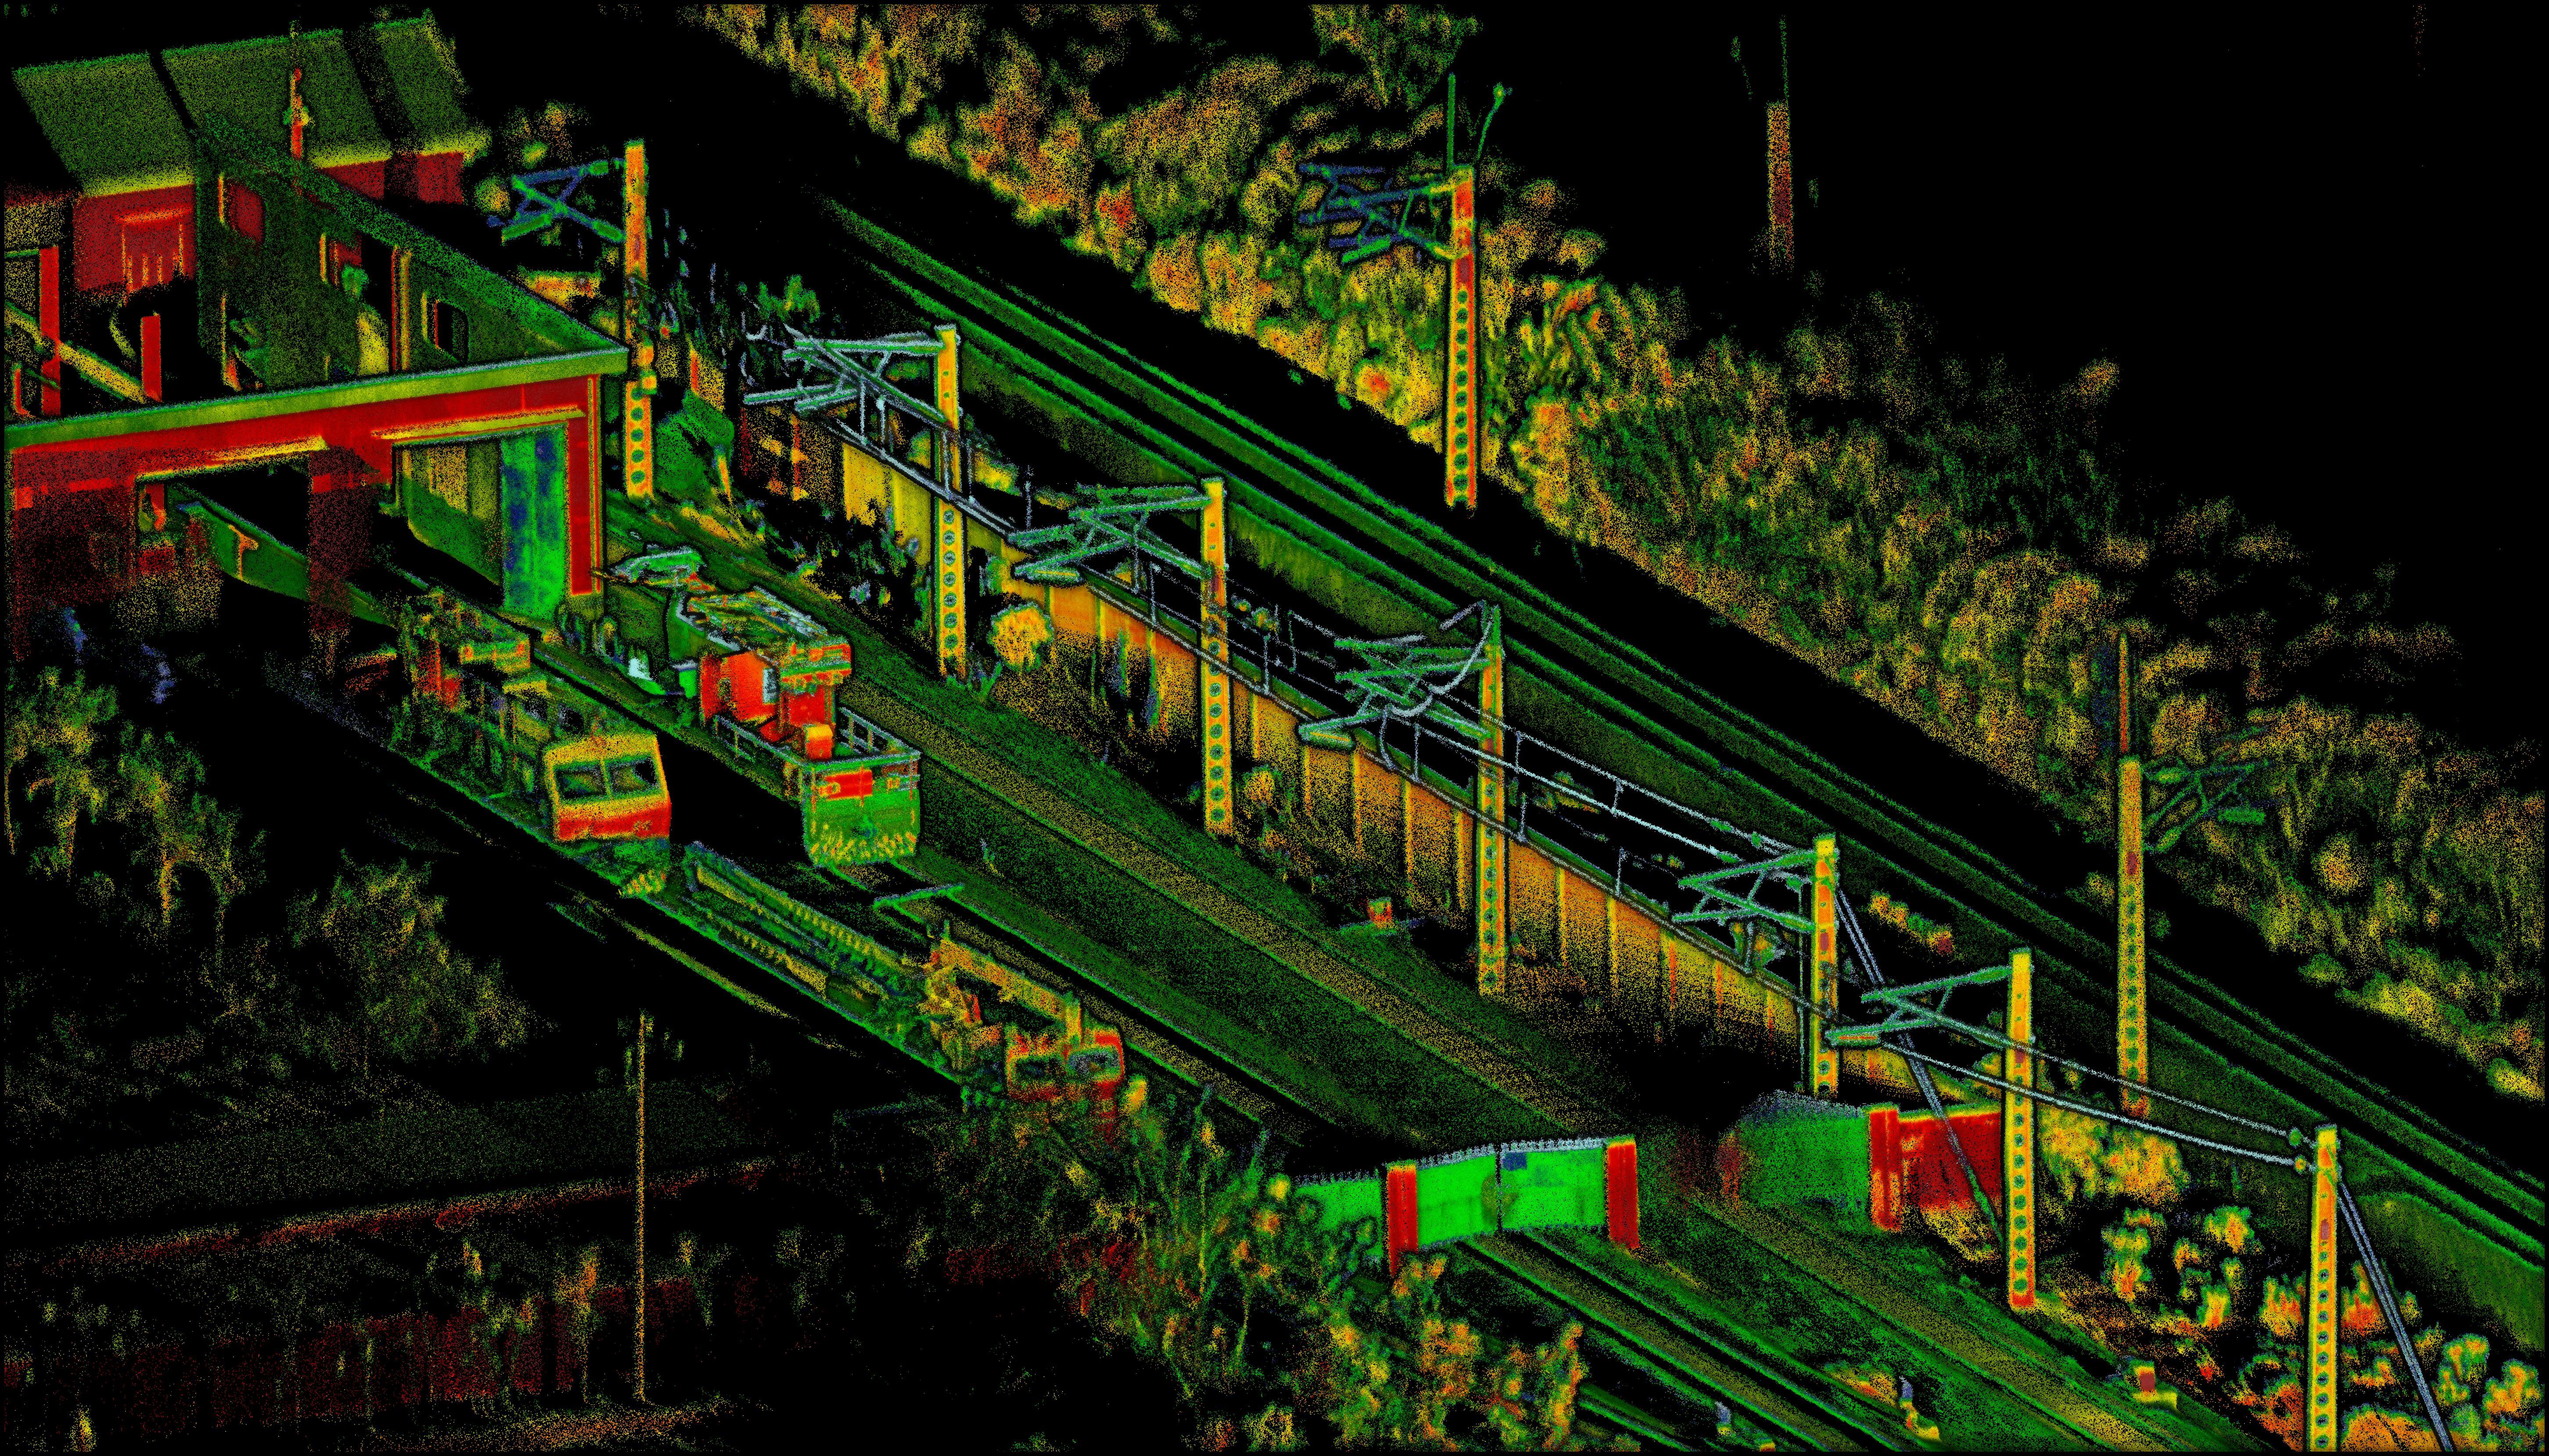
Image 6.2 The white power lines and transmission poles are easily distinguishable, making it easier to map the cables
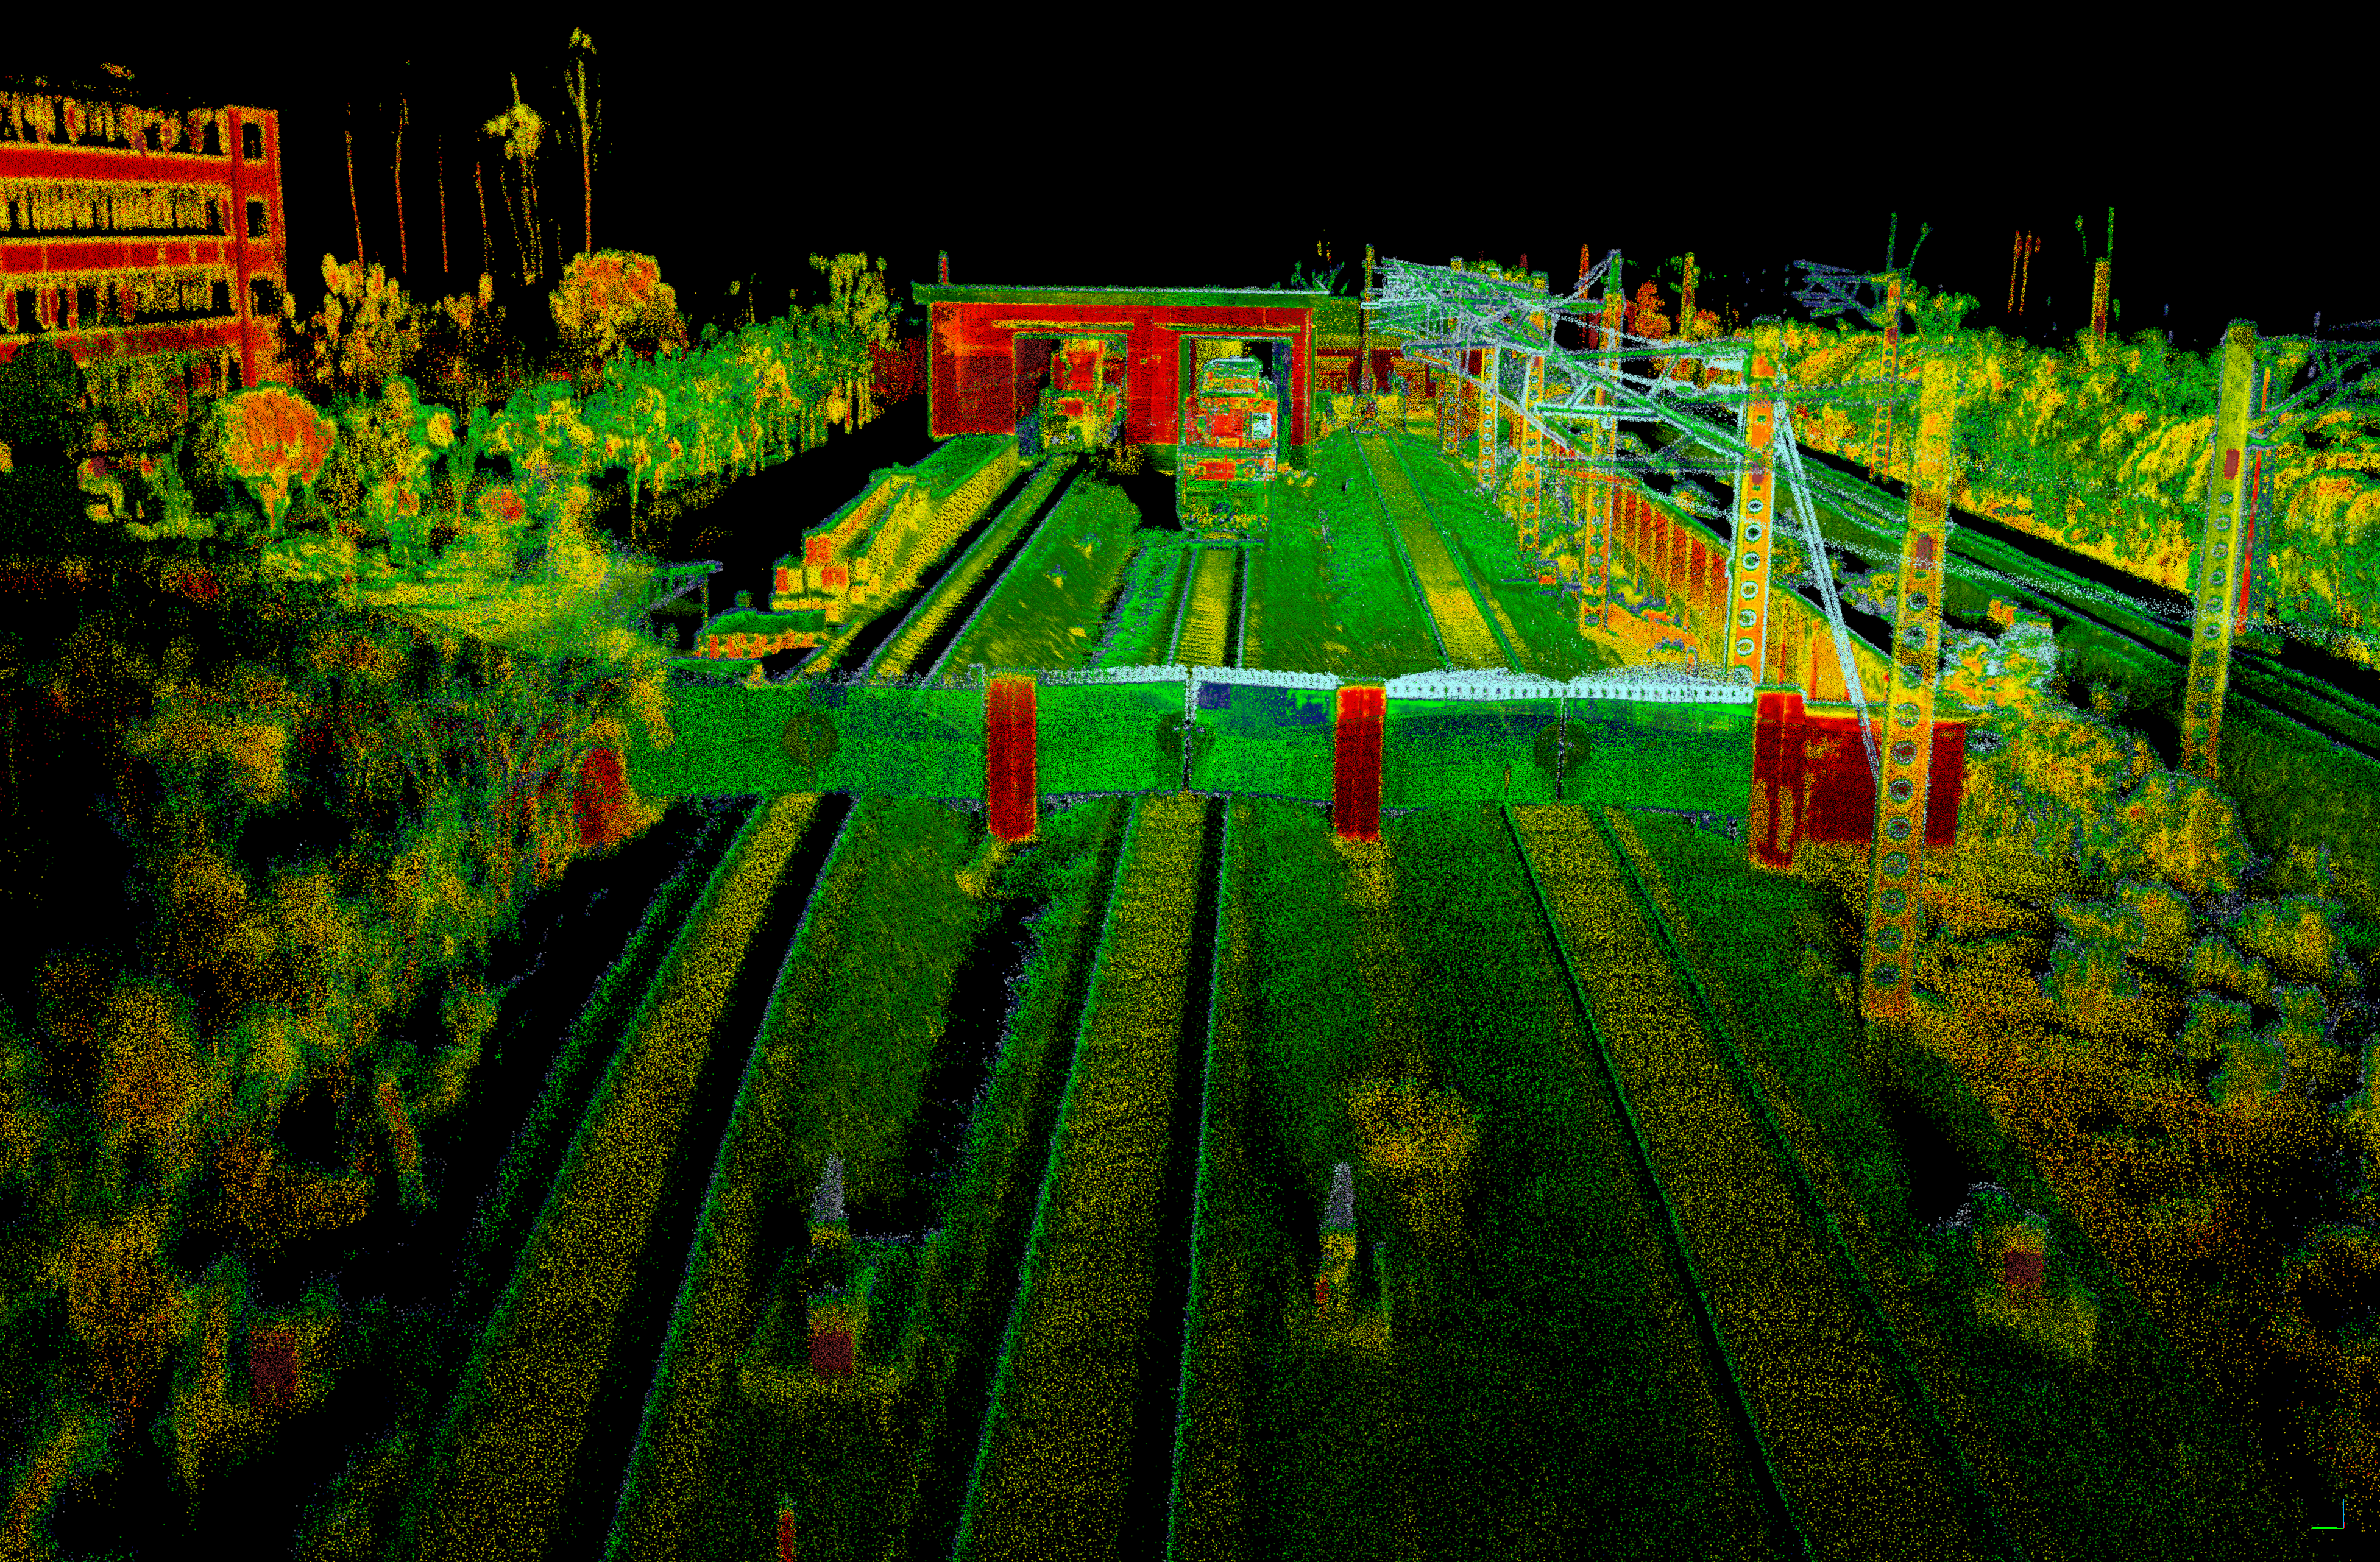
Image 6.3 The spikes on top of the gates are distinguishable and in sharp contrast with the rusty gates
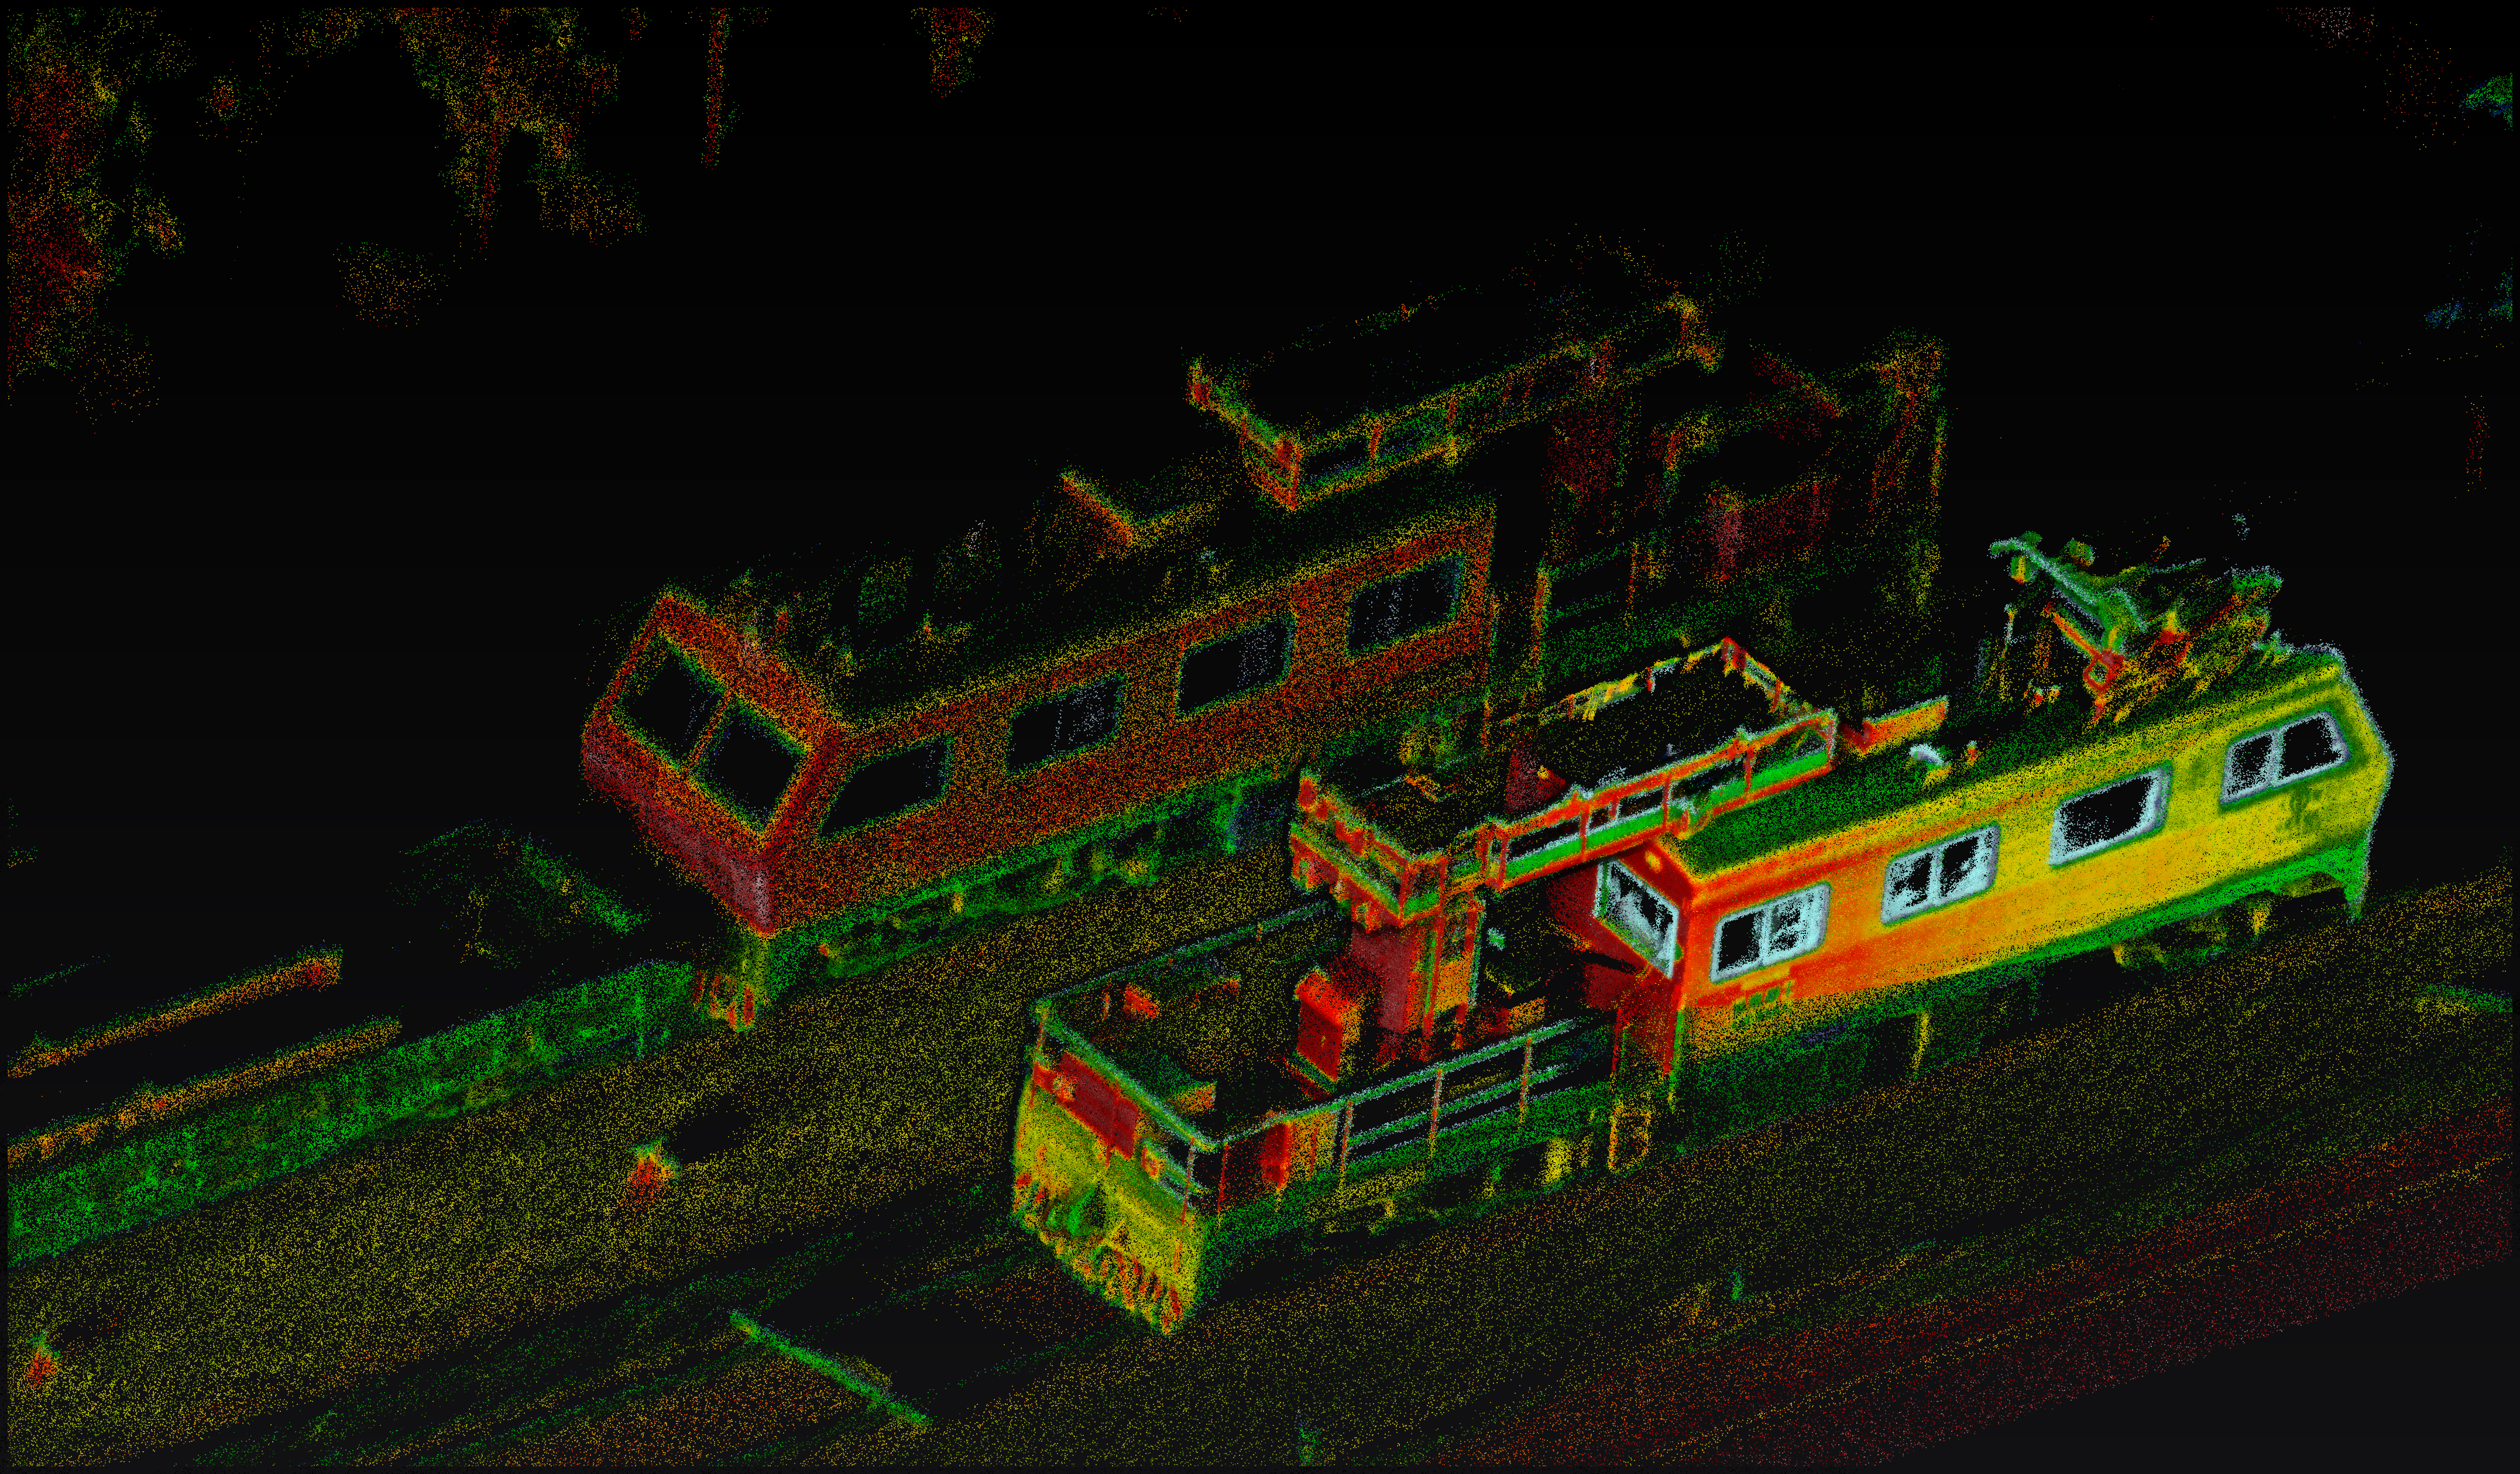
Image 6.4 The railway service cars have a clear outline, with the half-open and fully open glass windows even visible to the naked eye, and the sleepers behind the cars form a sharp contrast with the reflective metal.
To test the wider applicability of this method, the team used different lidars to generate maps of multiple scenes such as tunnels and road surface markings based on their reflectivity, and compared their display quality. They then applied the above method in a highway scenario to optimize the visual output.
Point cloud comparison for tunnels
In railway tunnels, drivers usually position and inspect their railcars through the identification numbers on the power poles. Therefore, good detection and display of power poles is crucial for the construction of a tunnel reference map.
In this test, the team created maps using the following four different lidars, including Livox Horizon. The Rail-SLAM algorithms, developed by the project team, were applied to the latter three lidars, and all output results were generated based on their default reflectivity.
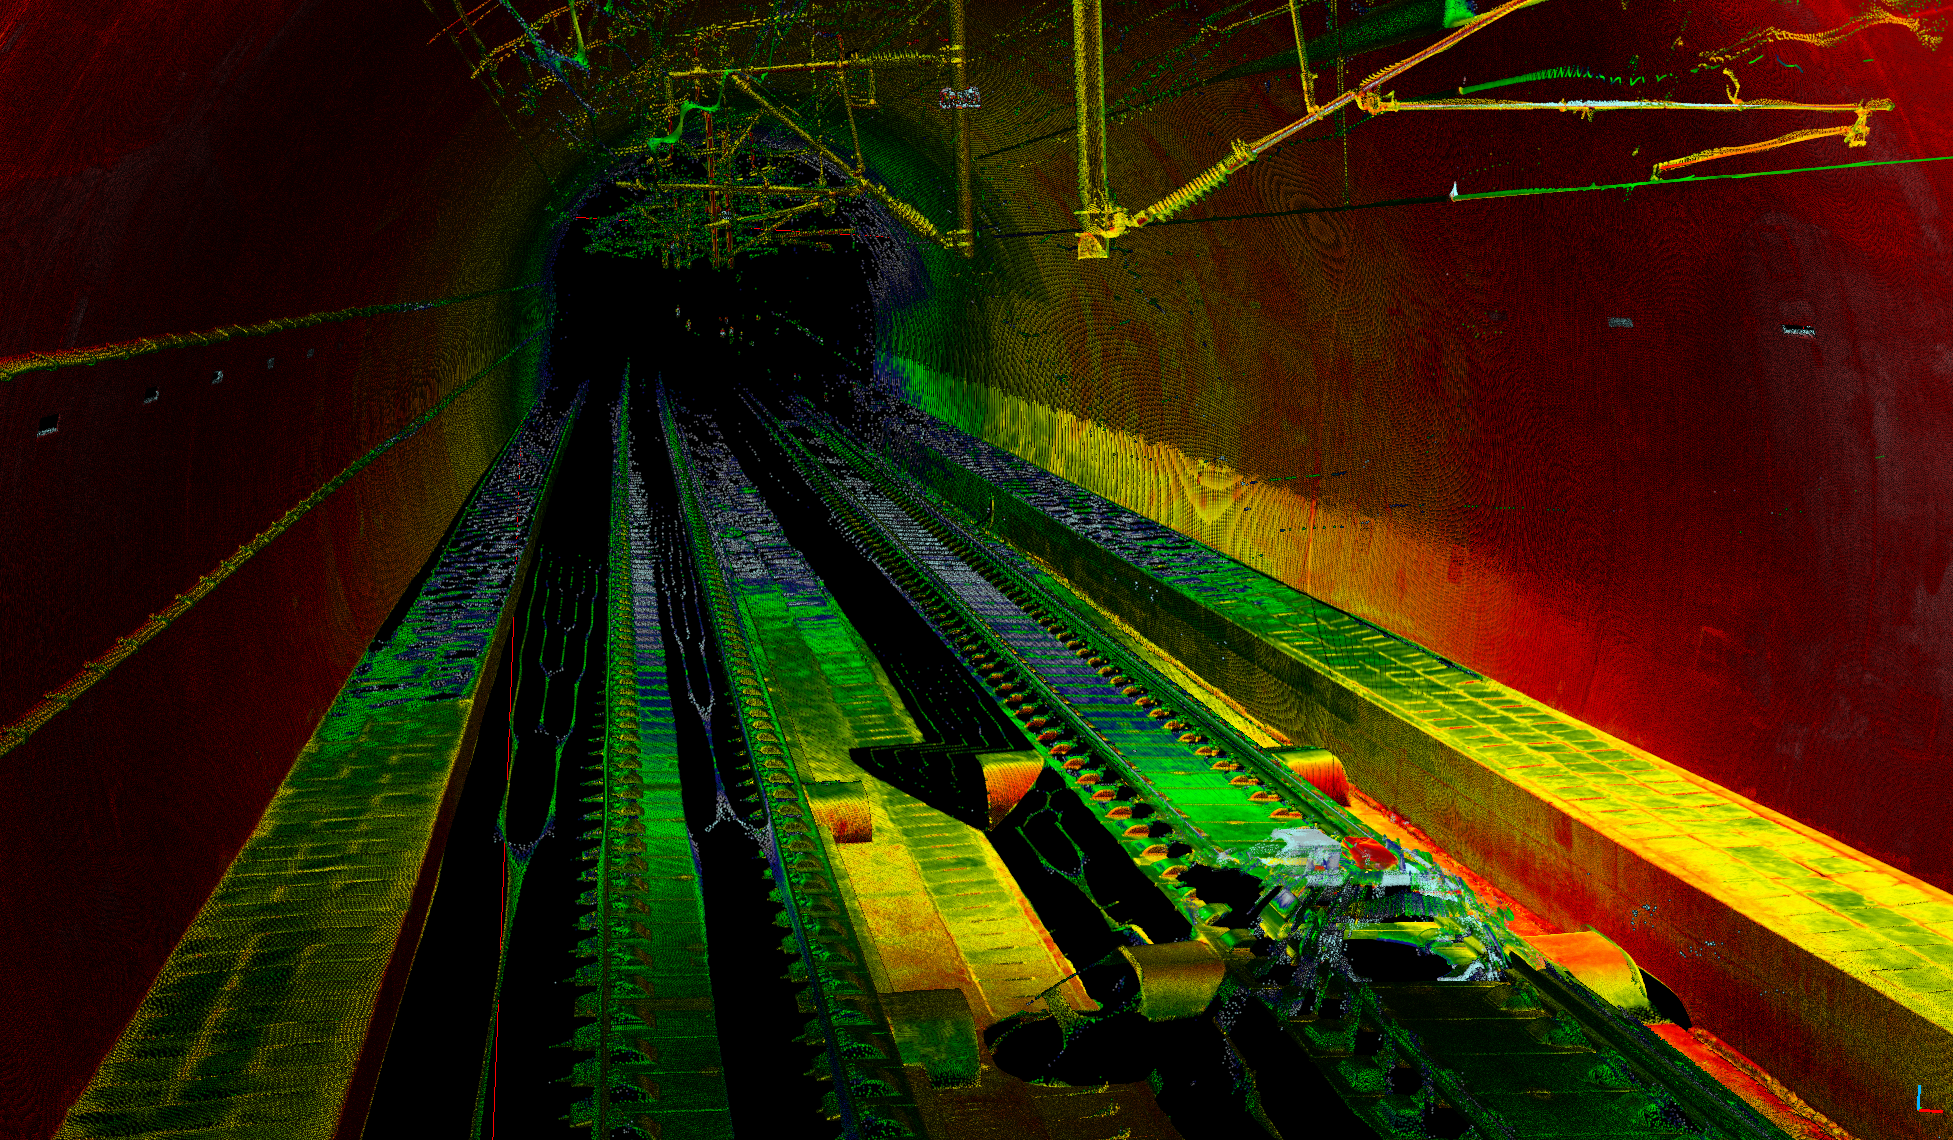
Image 7.1 Post-processed image generated using premium mapping-grade laser scanners and professional-grade navigation equipment
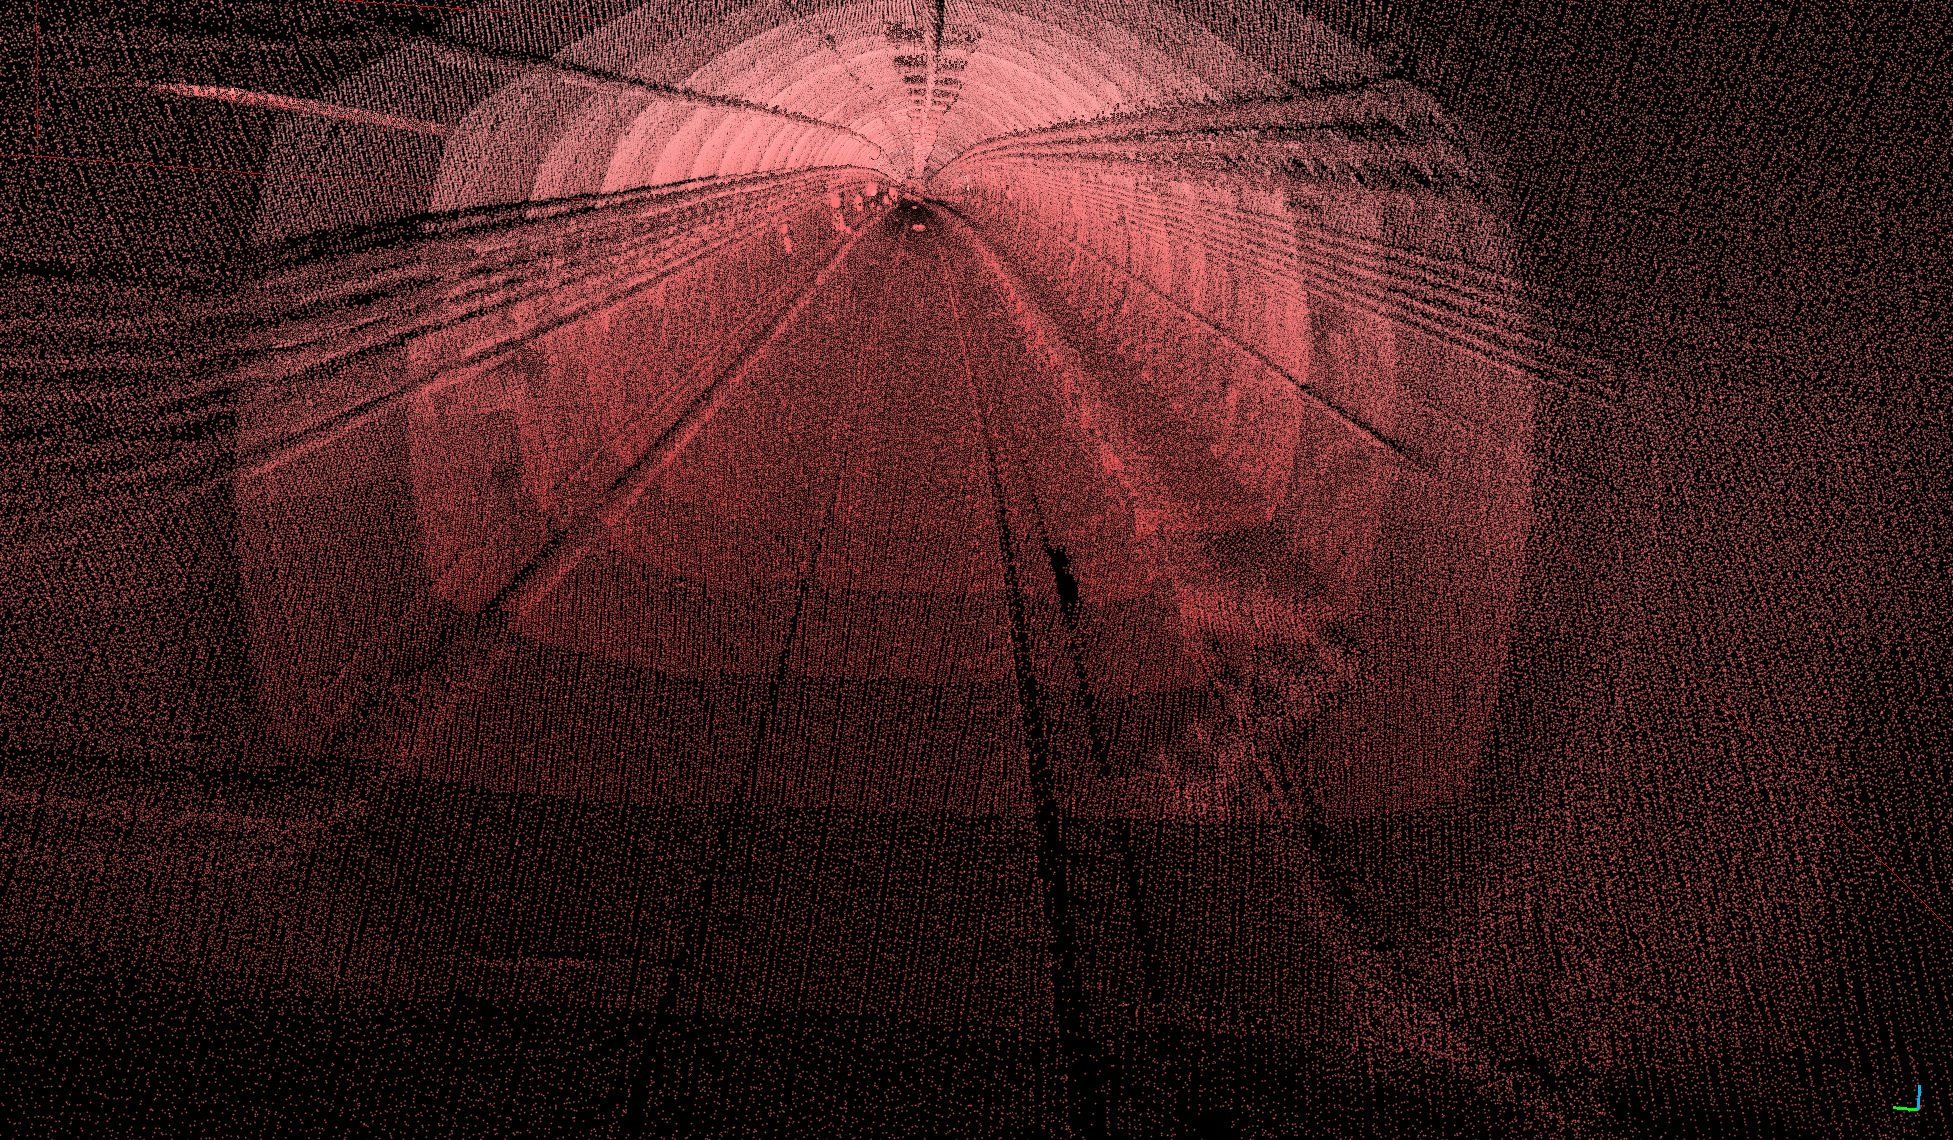
Image 7.2 Image generated by a high-beam semi-solid state lidar commonly used in intelligent traffic applications
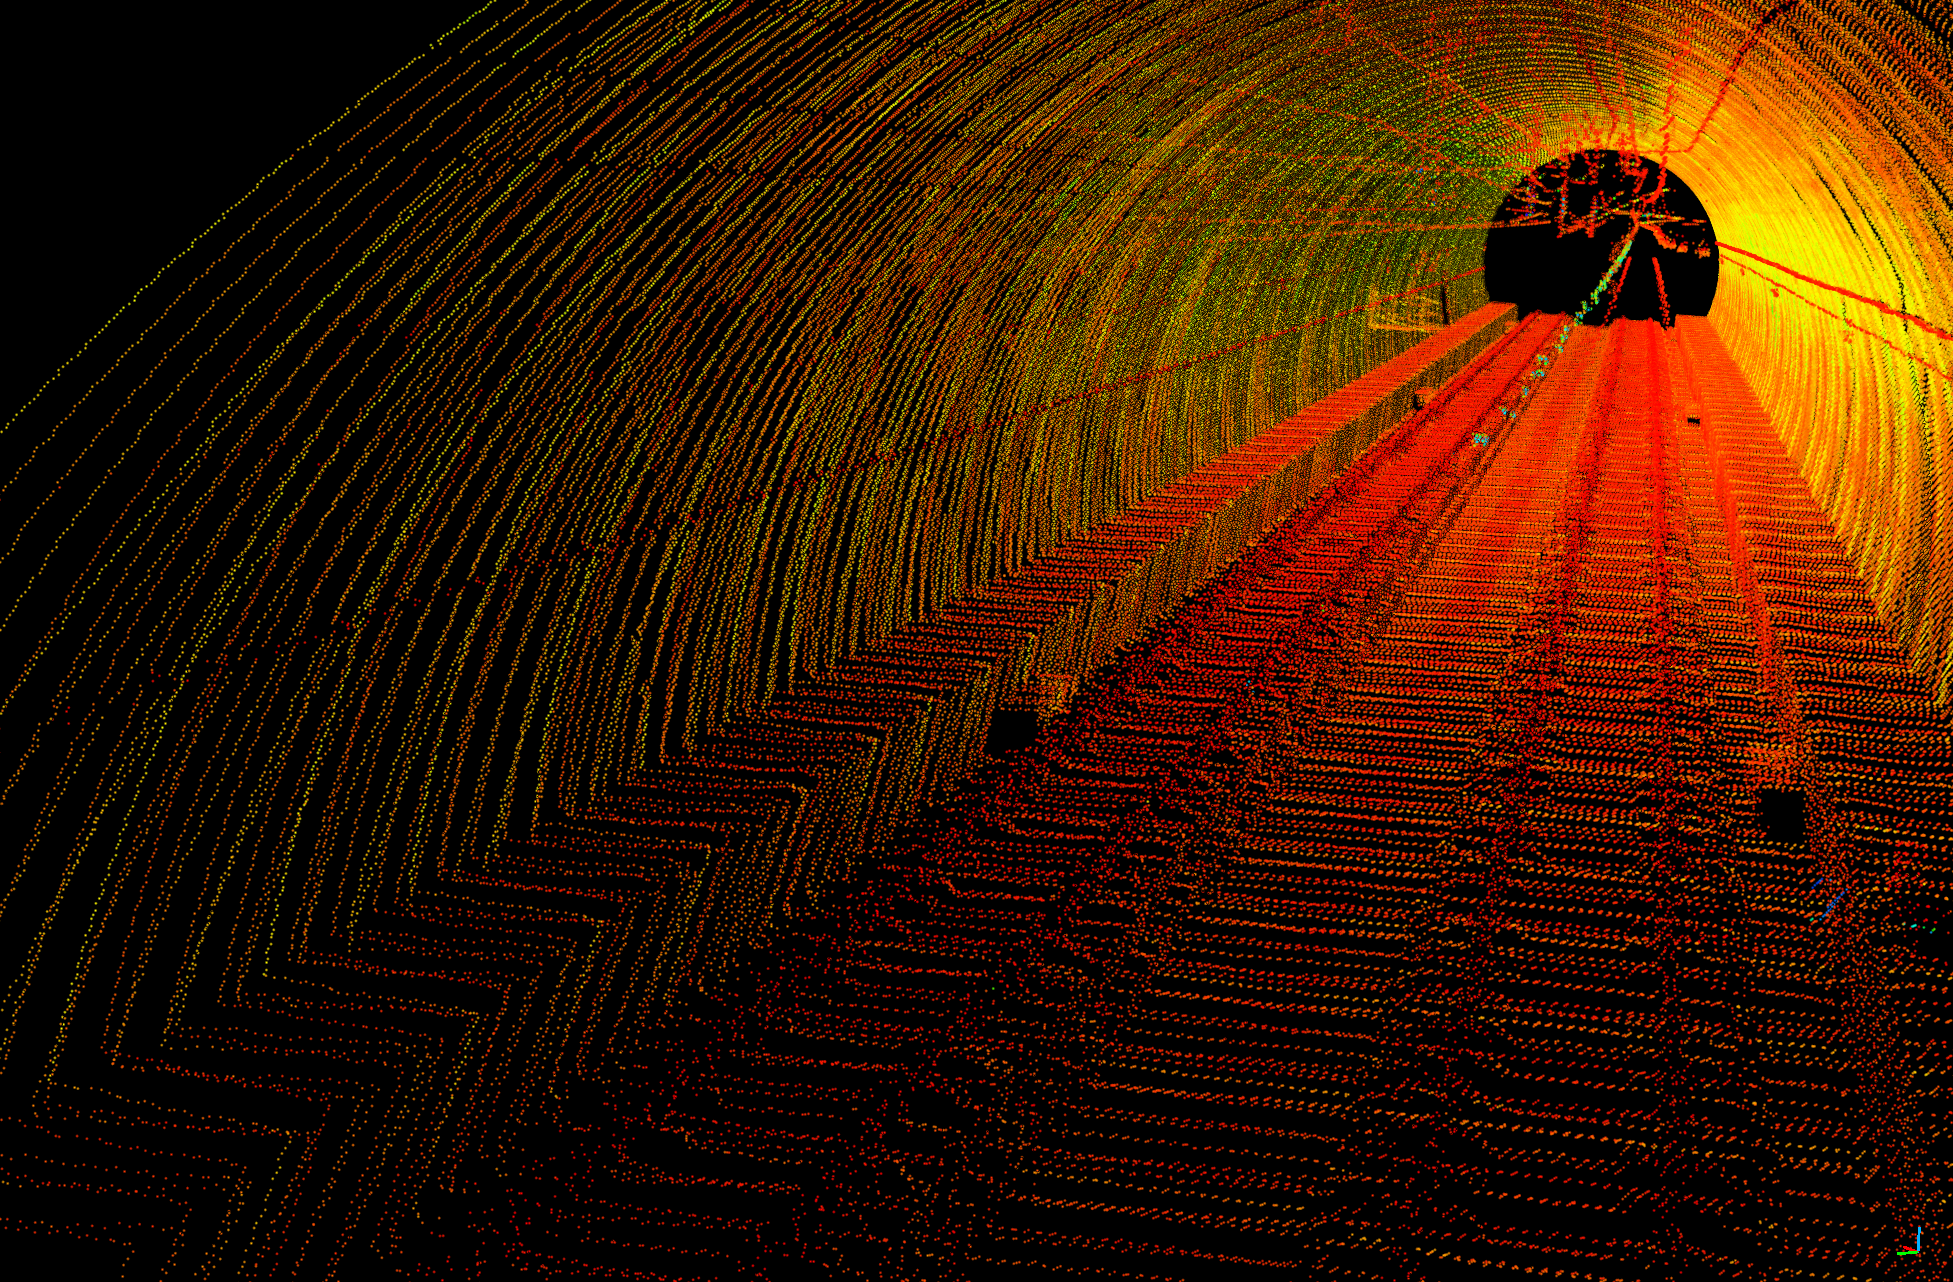
Image 7.3 Image generated by a traditional mechanical 16-beam lidar
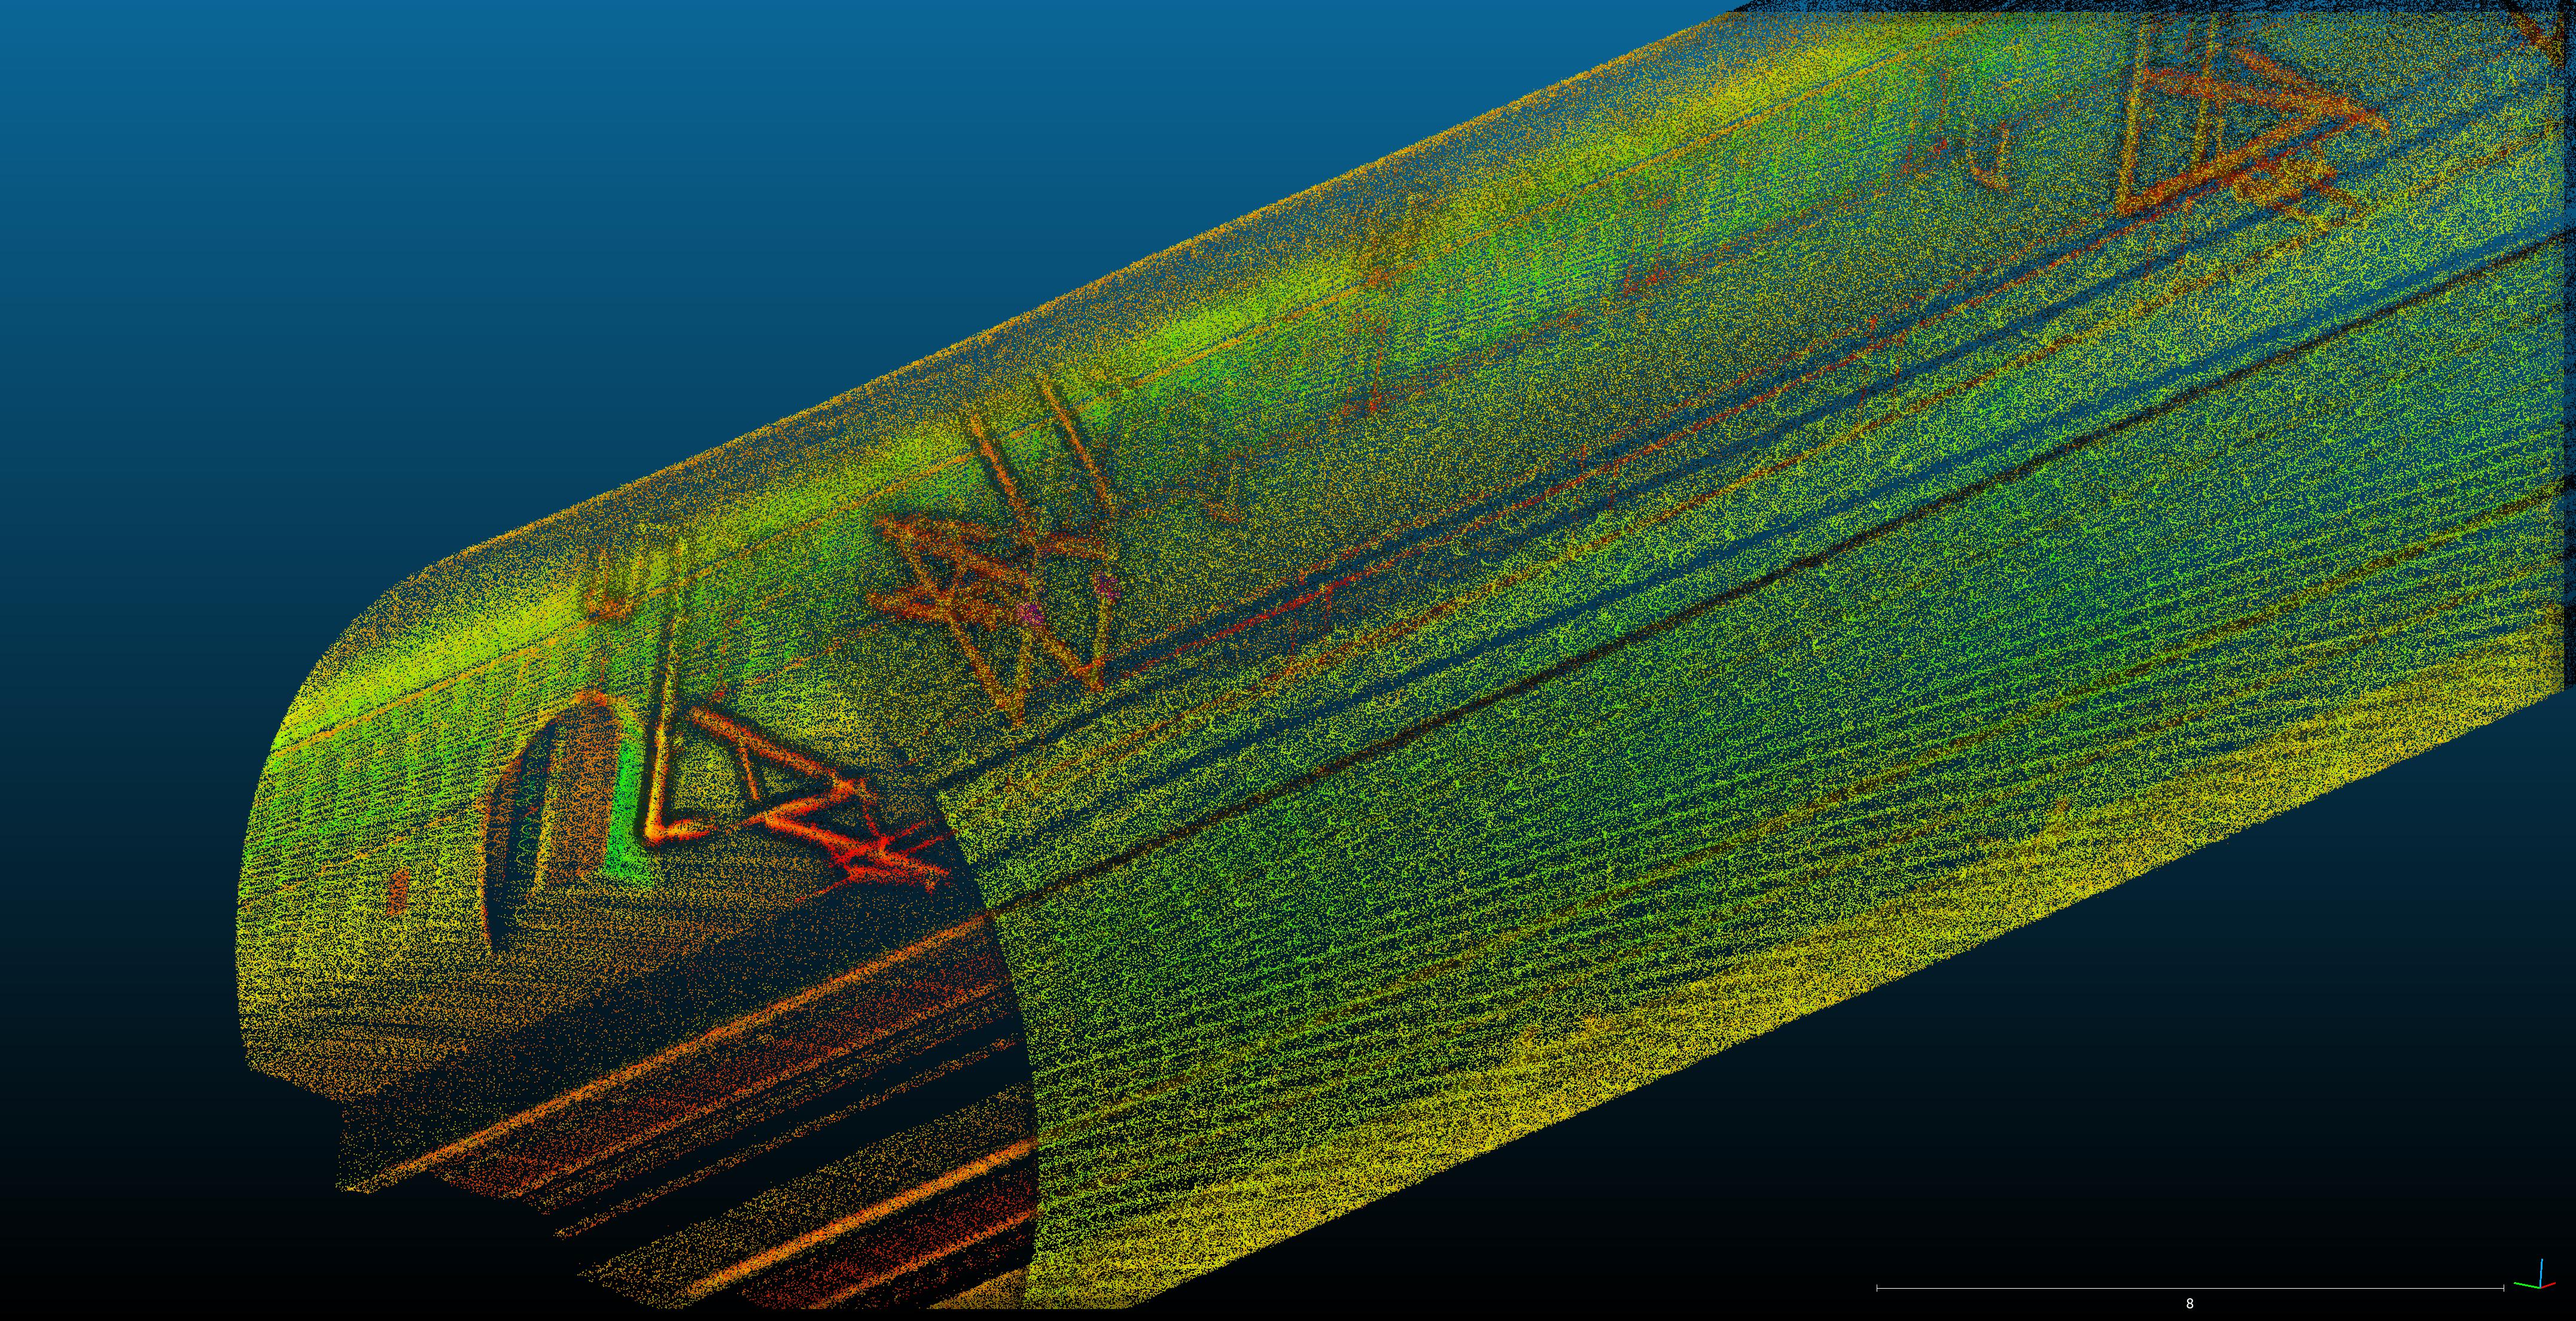
Image 7.4 Mapping by Livox Horizon
As shown in the image above, the map generated by Livox Horizon can already distinguish features such as the railway tracks and poles due to its high-precision measurement of reflectivity.
Road Markings Detection
Based on their extensive test experience, the team found that many lidars in the market are not able to distinguish road surface markings using default reflectivity, especially faint markings. Based on tests of the following real-time output generated by different lidars on RViz, 16 or 32-beam traditional mechanical lidars (i.e., fewer beams) are essentially unable to detect road surface markings and diamond-shaped road signs.
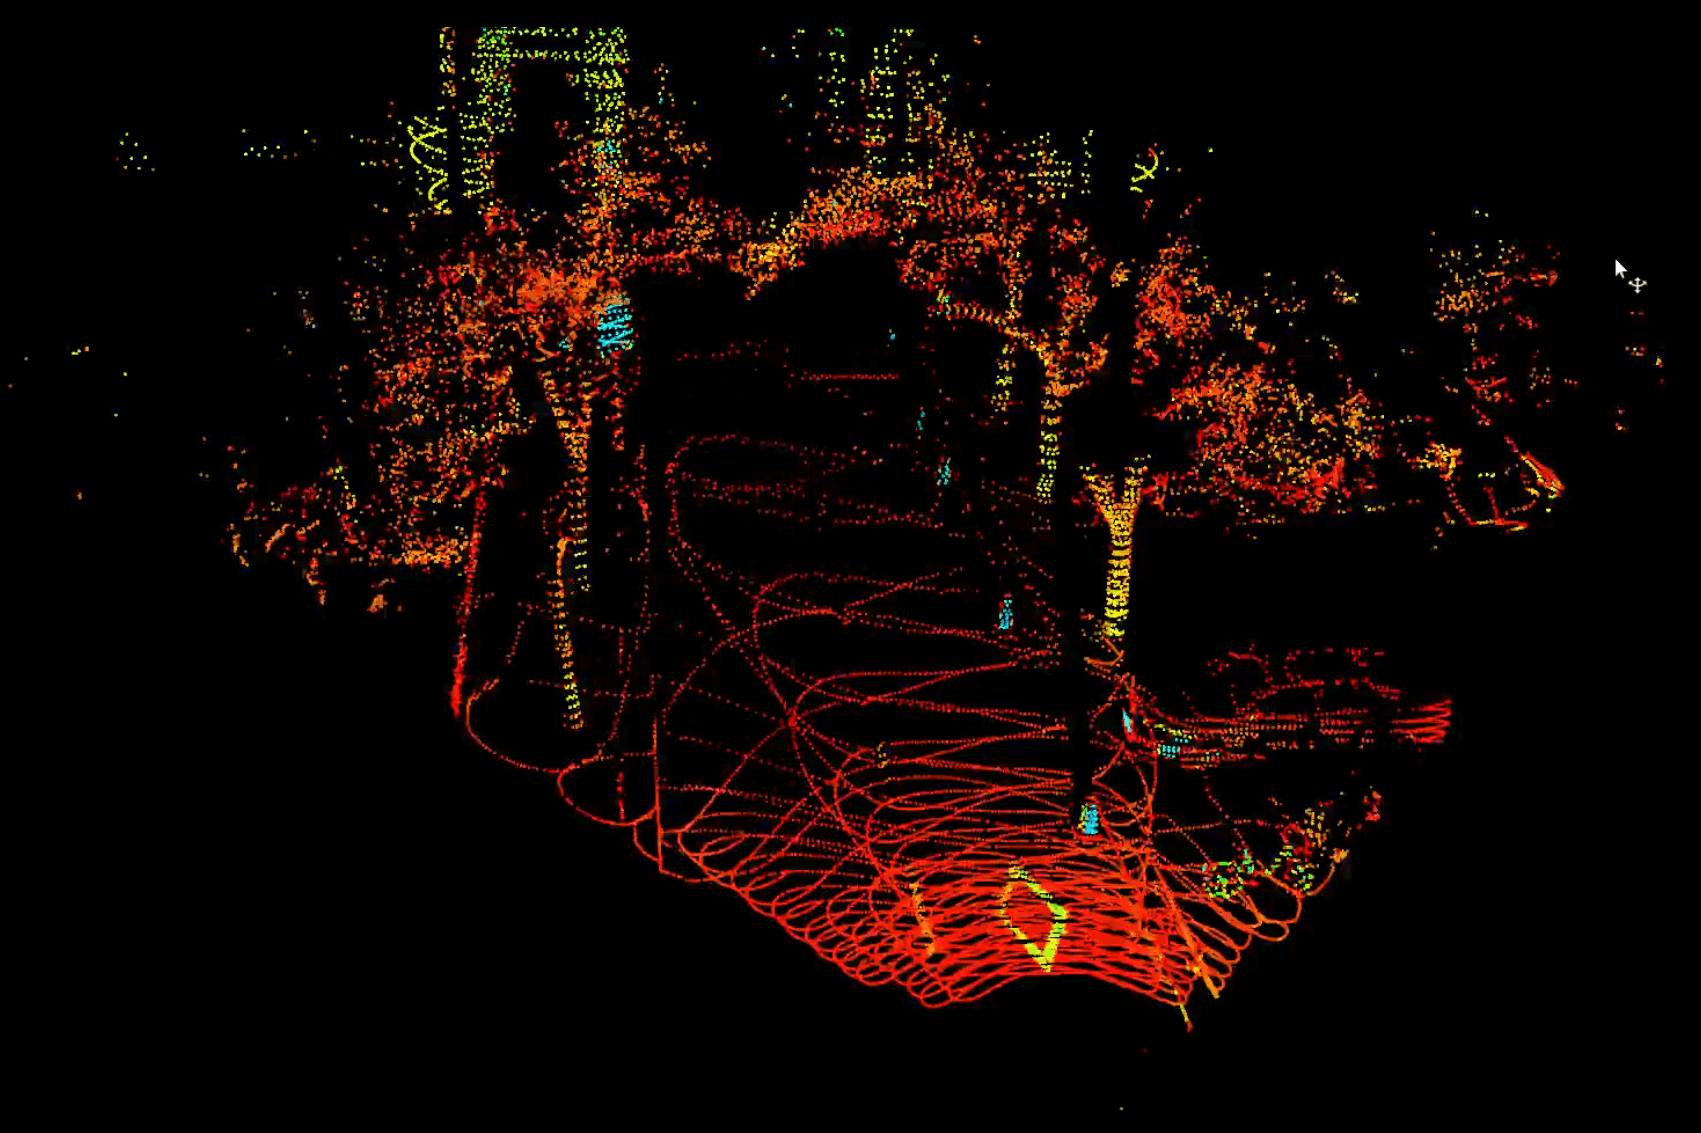
Image 8.1 Detection output by Livox Horizon
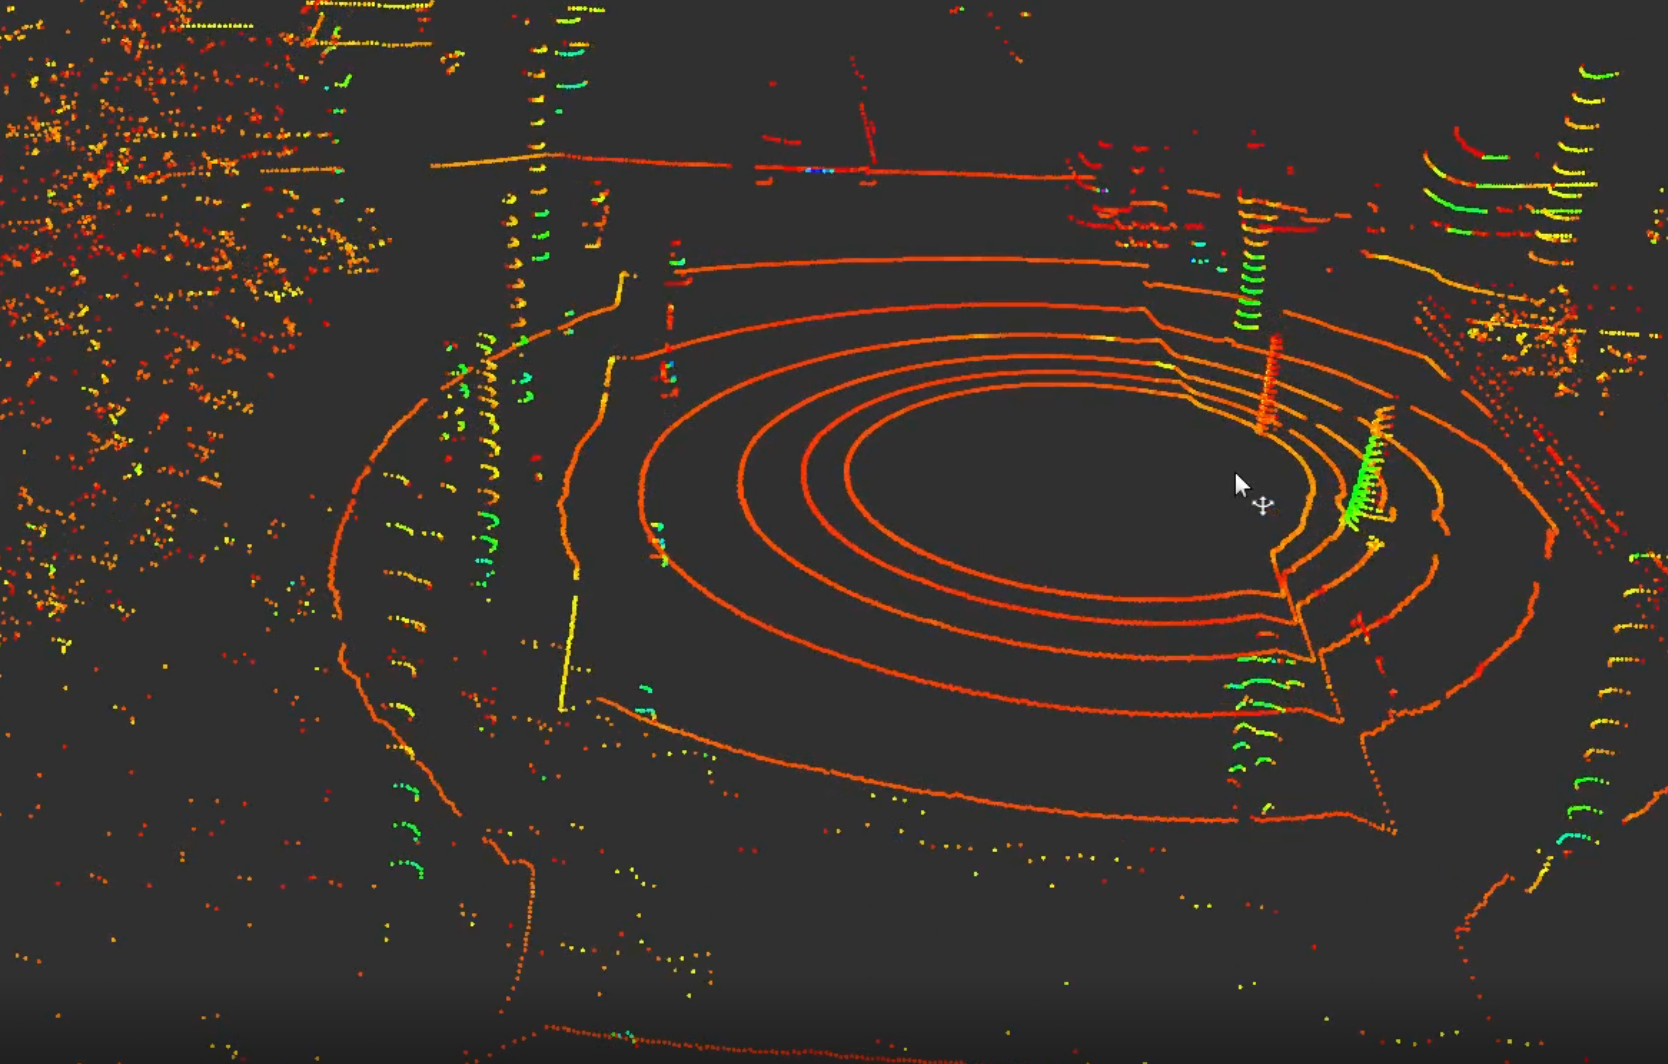
Image 8.2 Detection output by a traditional 16-beam lidar
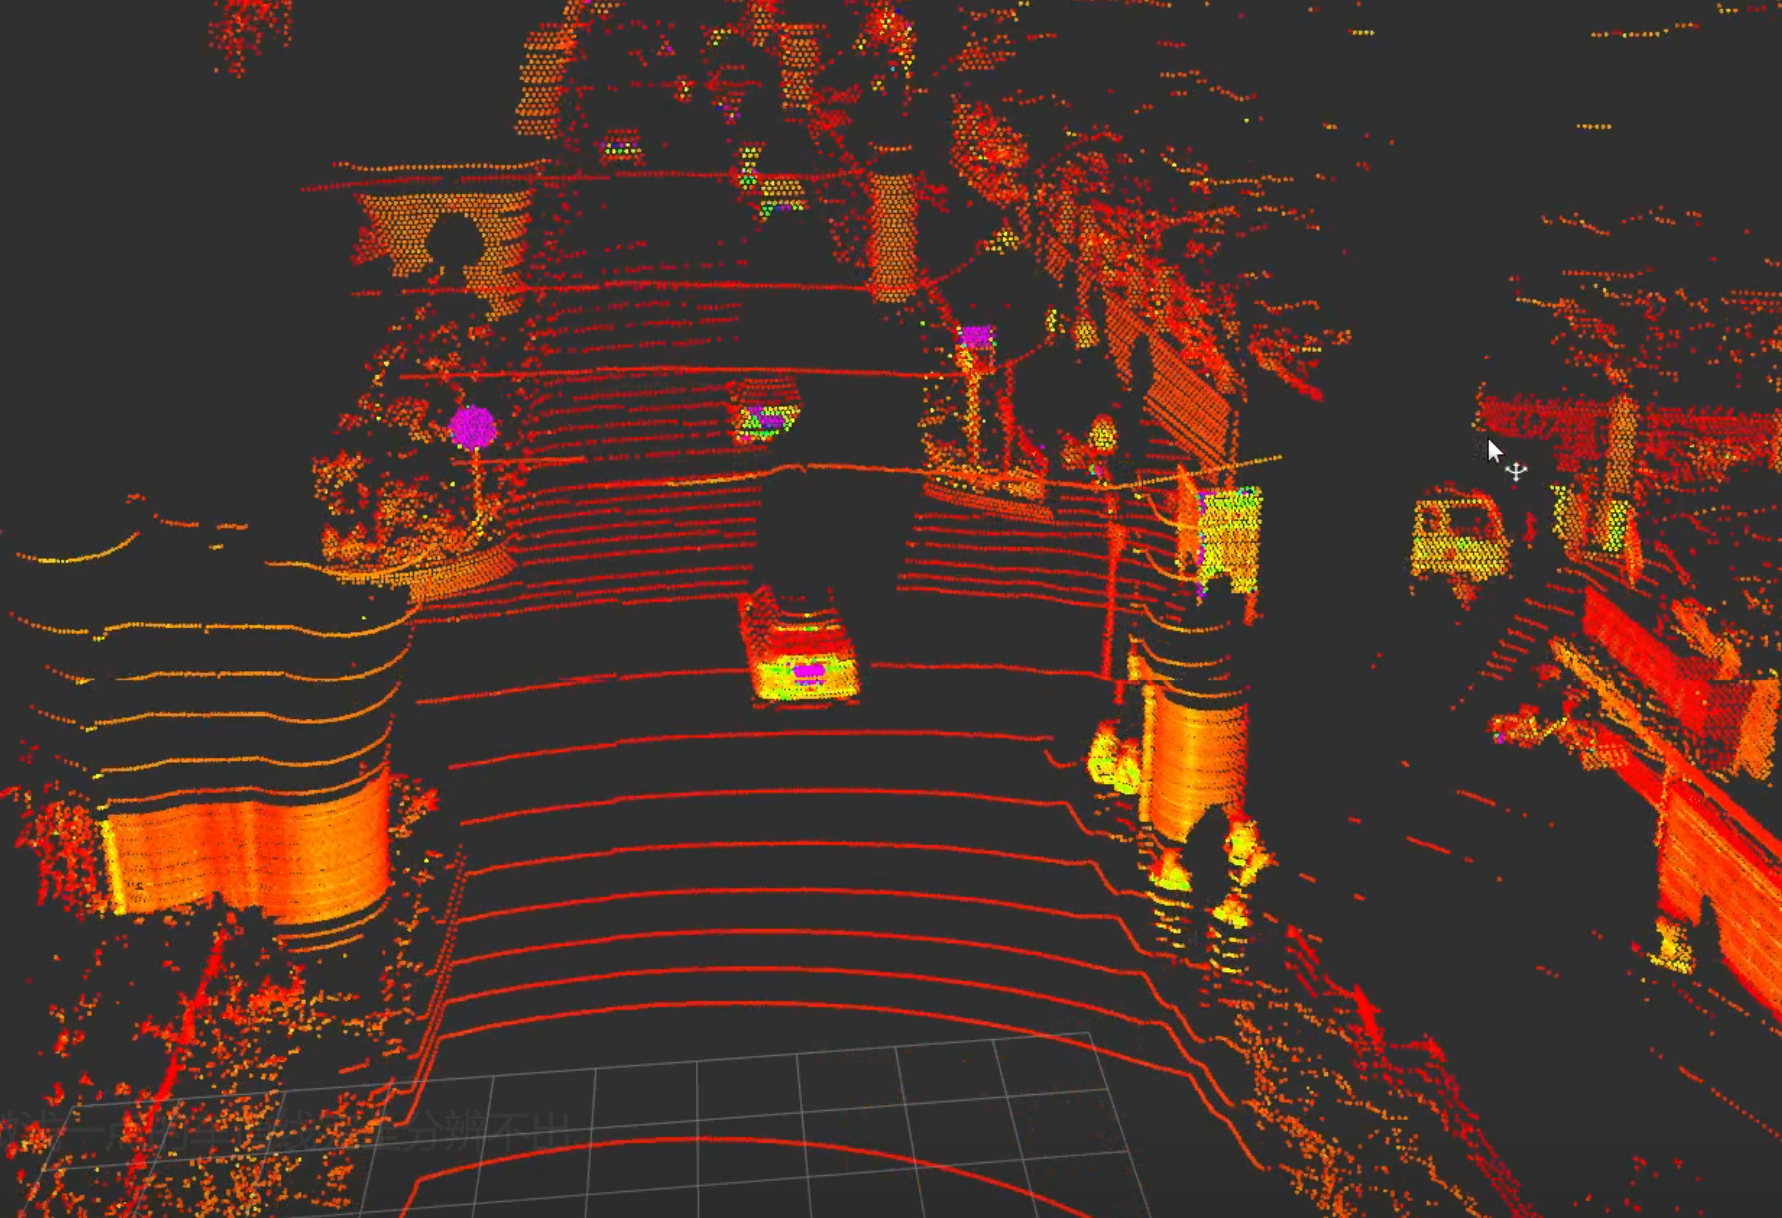
Image 8.3 Detection output by a traditional 40-beam lidar
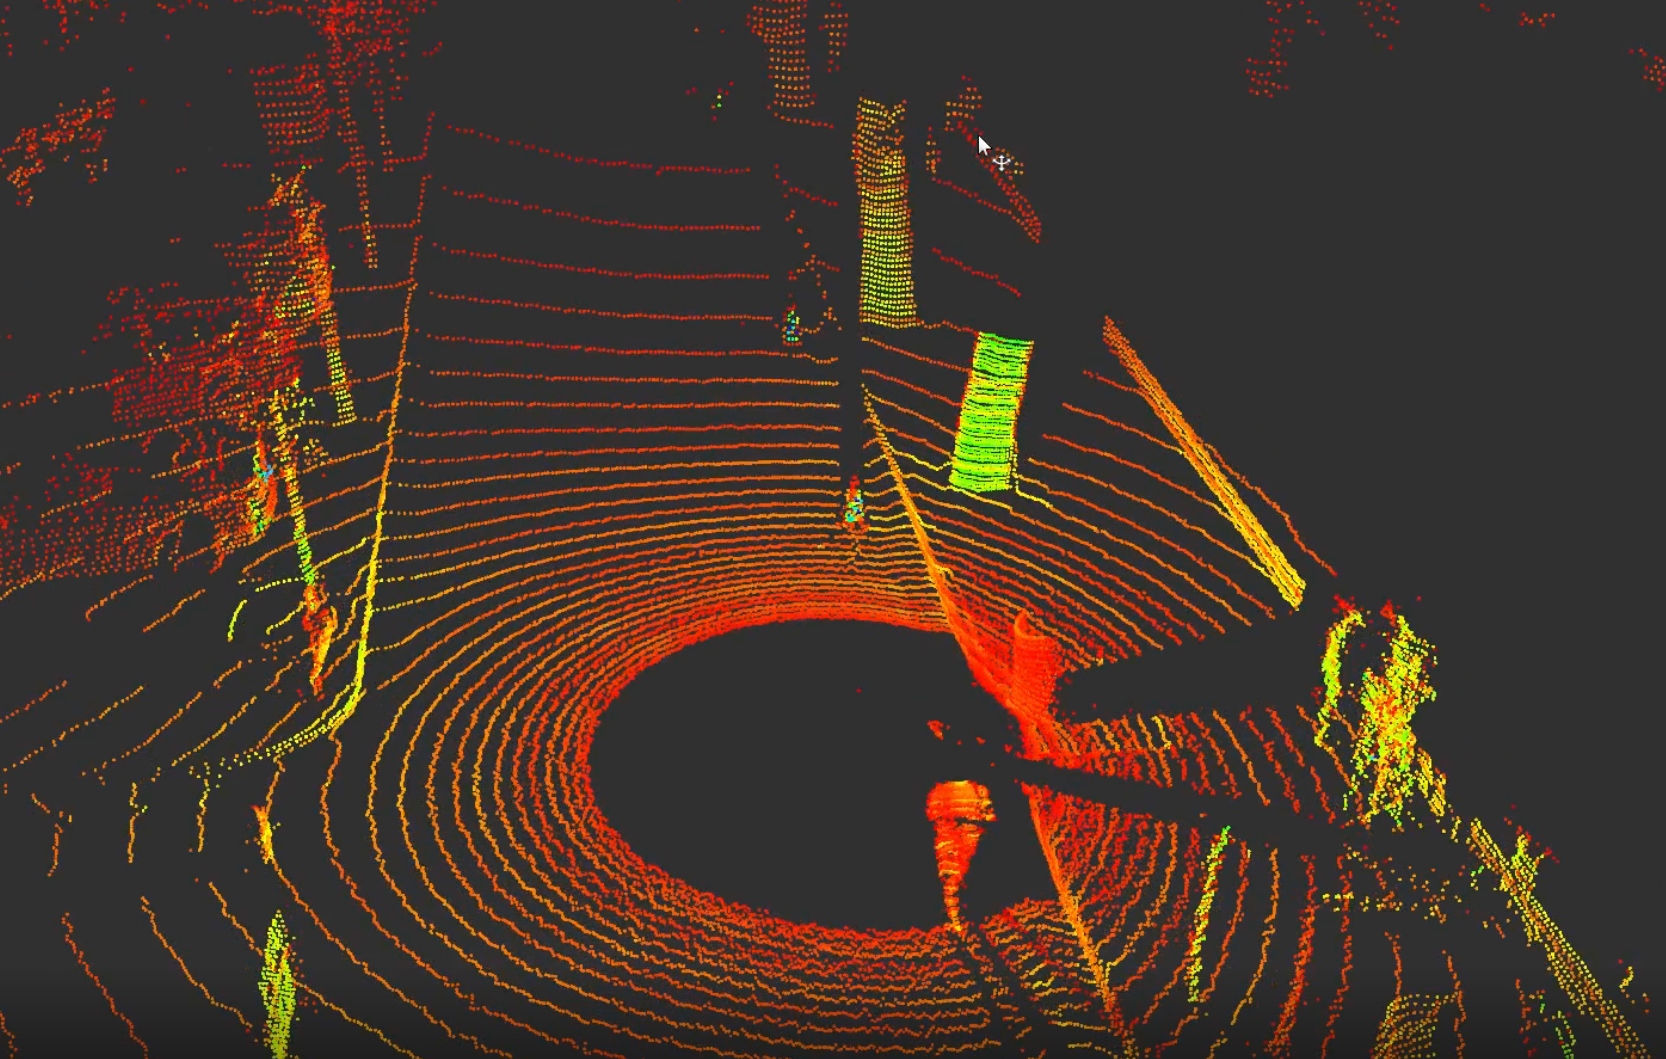
Image 8.4 Detection output by a traditional 64-line lidar
With Livox’s material optimization and high-precision resolution, we can see that Livox Horizon lidars deliver the best display results for road signs and surface markings.
Highways
Based on the above test on reflectivity, the team further applied the optimization methods in a highway scenario to facilitate the creation of a high-precision semantic map. To obtain a high-precision three-dimensional map of an urban area, the team deployed multiple Livox lidars with large FOV to map a large scene.
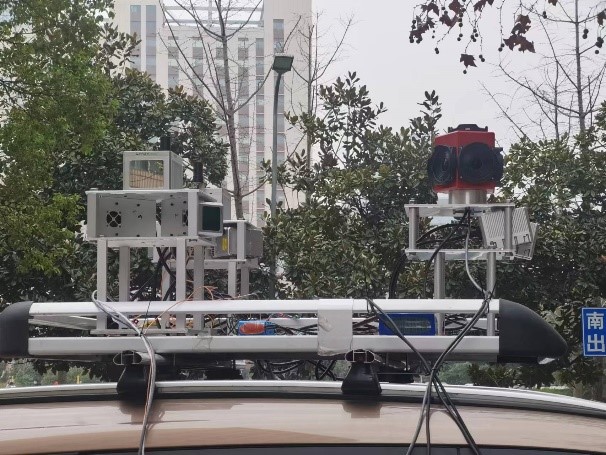
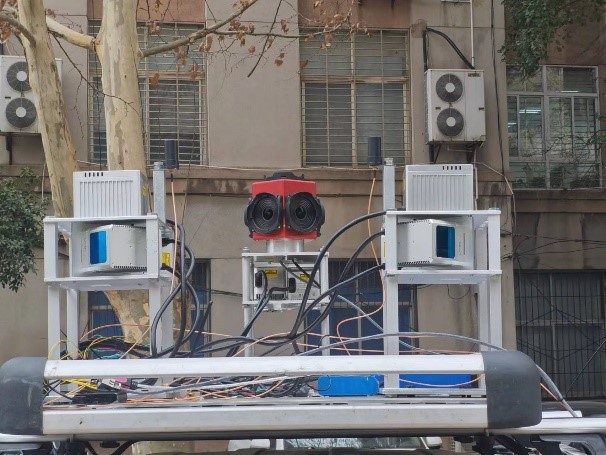
Image 9 Eight-lidar mapping platform (6 Livox Horizon and 2 Livox Tele-15)
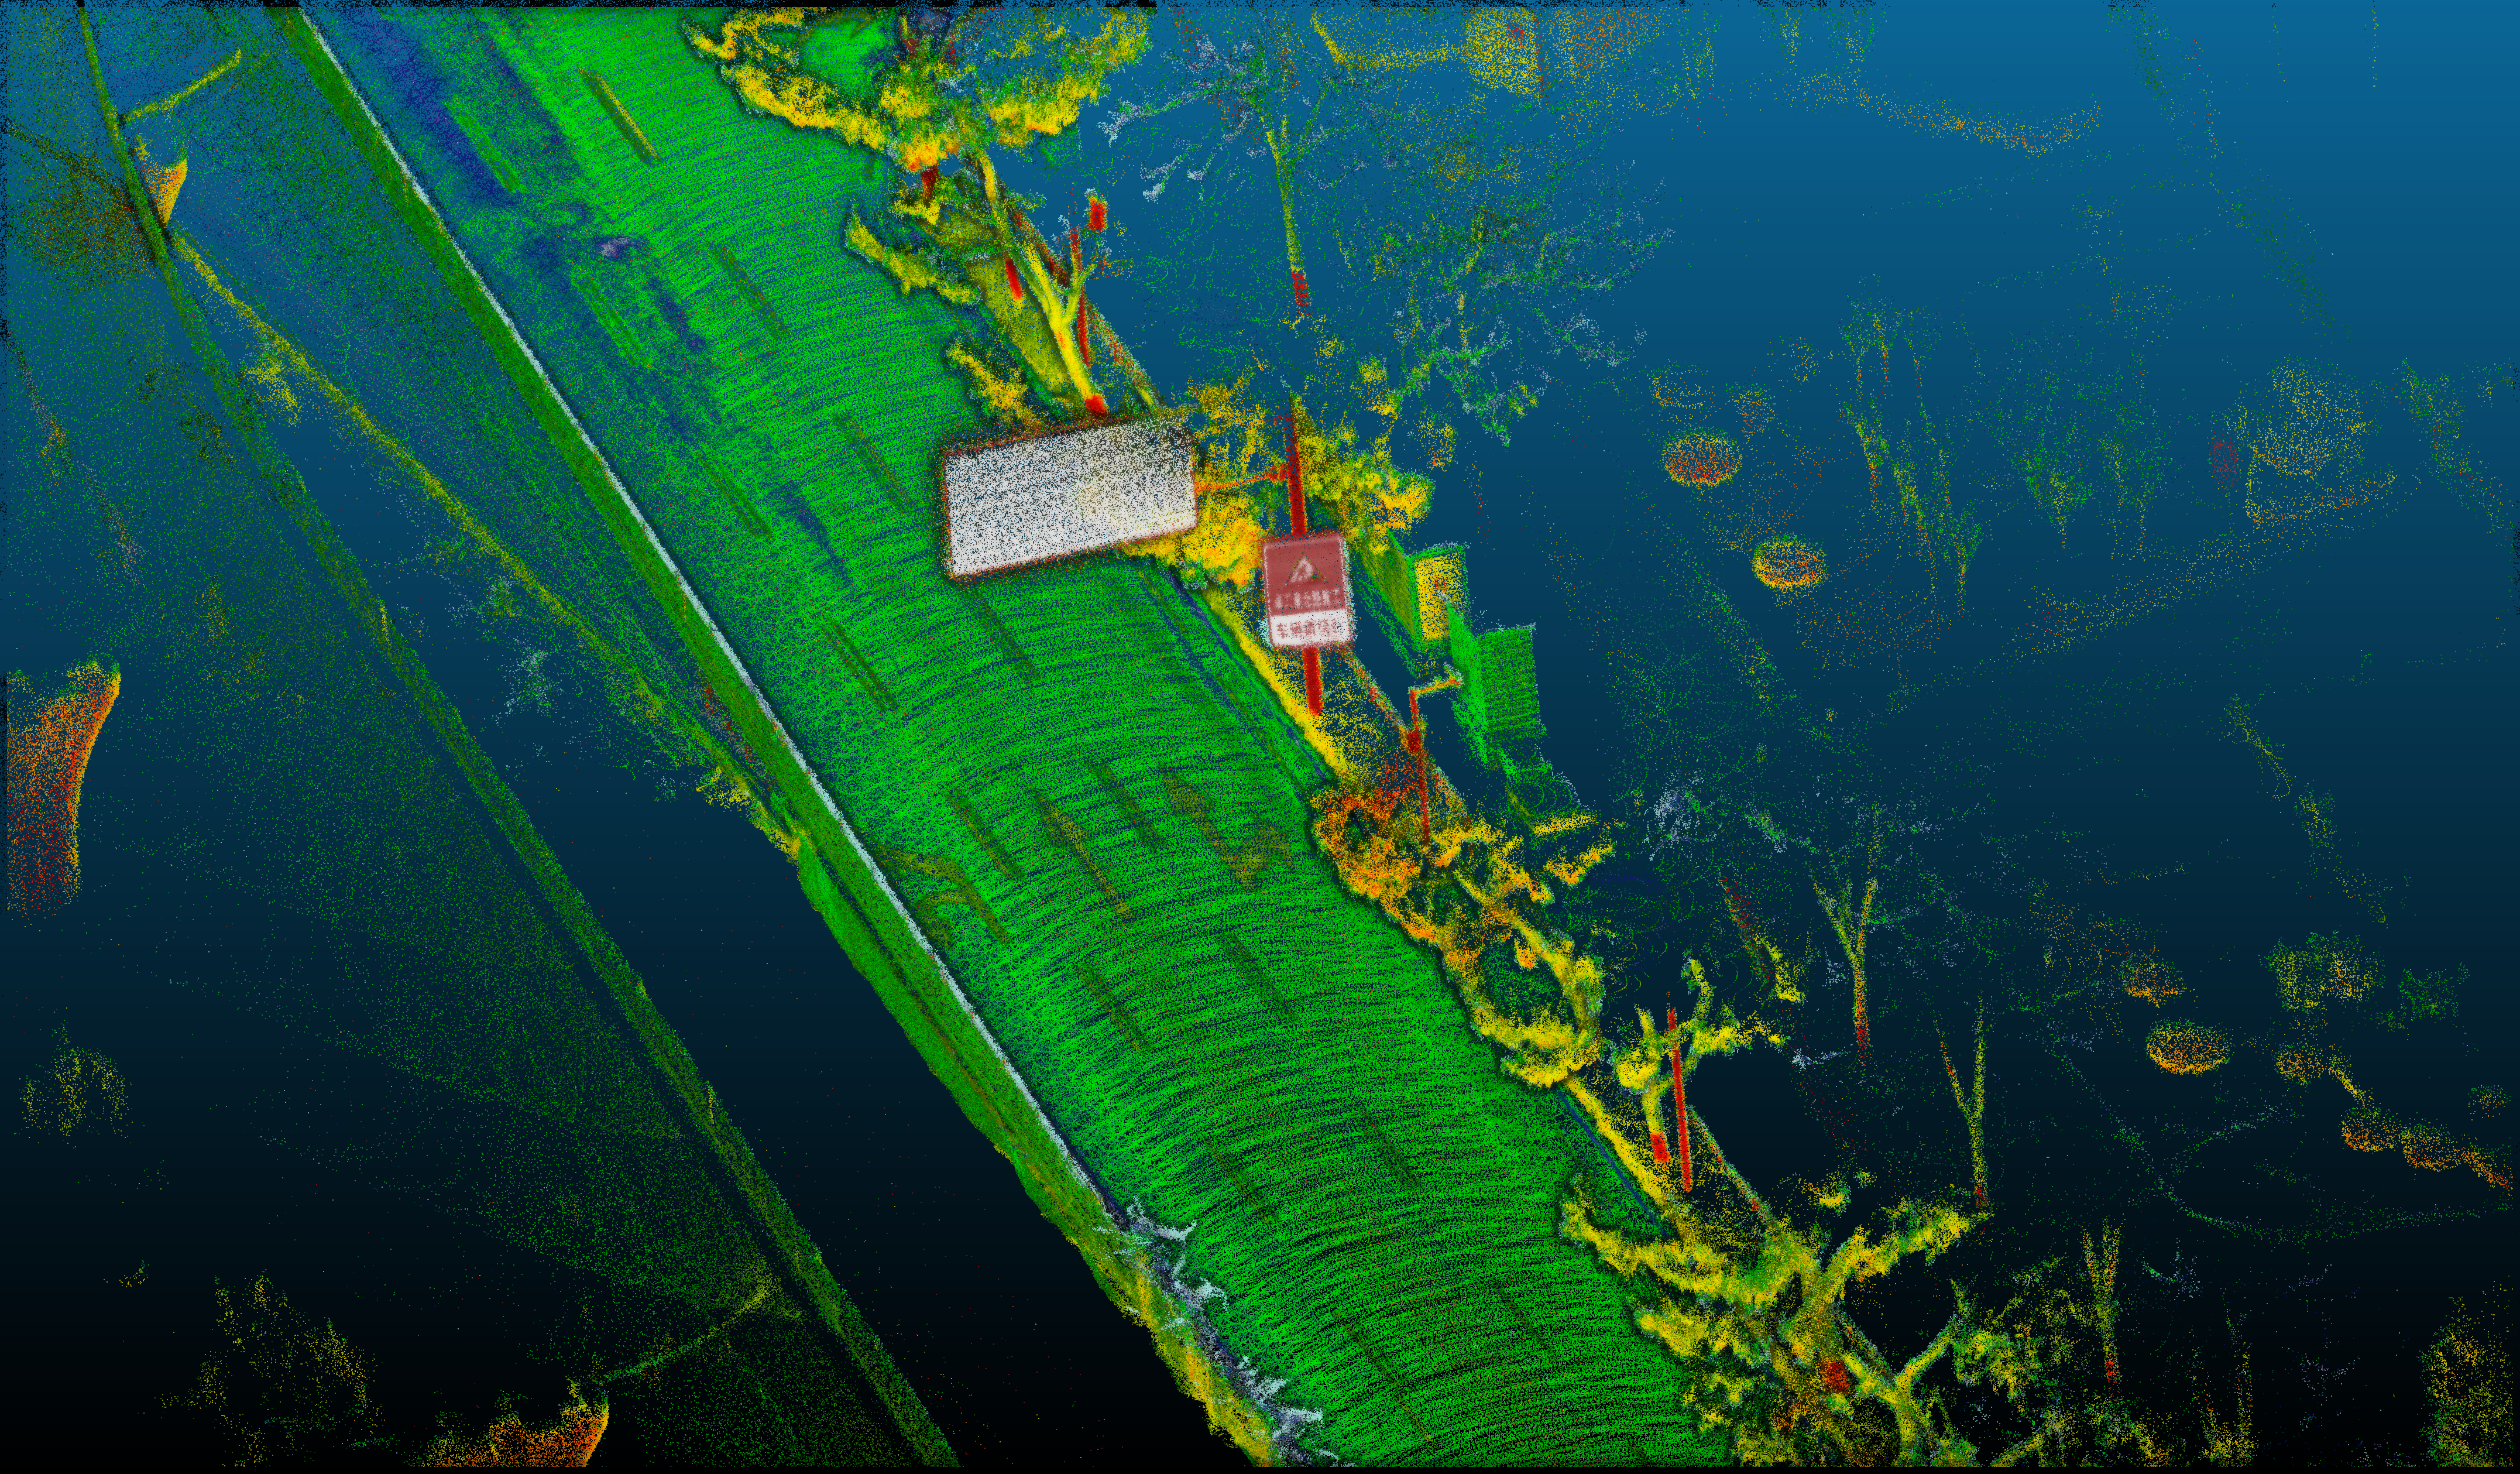
Image 10 Detection result after adjustment
Video 2 Mapping of a large highway scene
After reflectivity optimization, the Chinese characters on the road sign and surface (Image 10) became clear, which is helpful for feature selection by high-resolution map-makers and the work of map annotators.
The multiple tests above demonstrate that the high-precision reflectivity annotation by Livox lidars can yield excellent results for the detection of railway and road features such as road surface markings and railway tracks. The visualization outcome can be further enhanced through specific coloration patterns, to better assist in manual inspection and semantic annotation during high-precision mapping.
VaST Research Team of Wuhan University
The Versatile and Smart Transportation (VaST) group at Wuhan University is a research team led by Professor Lou Yidong and Professor Song Weiwei focused on self-driving applications for rail transportation. The team has achieved notable results in the field of high-precision positioning and environmental monitoring for rail transportation, with some of their research outcomes having been applied on a massive scale in railcars operated by the China Railway Shanghai Group.
Reference
[1] Wang, Y., Lou, Y., Song, W., & Tu, Z. (2022). A Tightly-Coupled Framework for Large-Scale Map Construction with Multiple Non-Repetitive Scanning LiDARs. IEEE Sensors Journal.